|
Download Data (XLS File) |
|
||||||||
|
||||||||
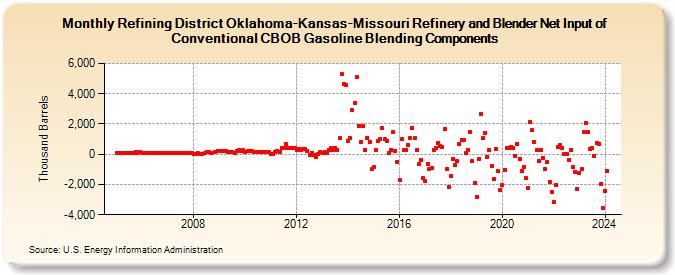
| Refining District Oklahoma-Kansas-Missouri Refinery and Blender Net Input of Conventional CBOB Gasoline Blending Components (Thousand Barrels) | ||||||||
| Year | Jan | Feb | Mar | Apr | May | Jun | Jul | Aug | Sep | Oct | Nov | Dec |
|---|---|---|---|---|---|---|---|---|---|---|---|---|
| 2005 | 91 | 82 | 96 | 108 | 104 | 109 | 113 | 103 | 101 | 131 | 110 | 125 |
| 2006 | 104 | 106 | 91 | 100 | 106 | 70 | 52 | 98 | 102 | 88 | 87 | 100 |
| 2007 | 99 | 87 | 76 | 80 | 57 | 57 | 58 | 67 | 57 | 84 | 70 | 54 |
| 2008 | 26 | 40 | 57 | 44 | 47 | 70 | 117 | 114 | 51 | 177 | 235 | |
| 2009 | 225 | 202 | 197 | 184 | 178 | 123 | 122 | 79 | 199 | 252 | 232 | 251 |
| 2010 | 152 | 209 | 213 | 217 | 164 | 128 | 129 | 133 | 152 | 173 | 140 | 129 |
| 2011 | 26 | 44 | 173 | 227 | 128 | 386 | 427 | 671 | 436 | 398 | 421 | 433 |
| 2012 | 311 | 318 | 266 | 366 | 328 | 211 | -51 | 111 | -50 | -181 | -16 | 147 |
| 2013 | 60 | 149 | 57 | 304 | 401 | 301 | 412 | 273 | 1,066 | 5,319 | 4,630 | 4,598 |
| 2014 | 855 | 1,040 | 2,895 | 3,390 | 5,084 | 1,889 | 817 | 1,843 | 297 | 1,101 | 832 | -999 |
| 2015 | -872 | 255 | 865 | 988 | 1,729 | 984 | 901 | 64 | 291 | 1,449 | 210 | -538 |
| 2016 | -1,724 | 977 | 252 | 248 | 609 | 1,086 | 1,758 | 1,058 | 262 | -658 | -373 | -1,579 |
| 2017 | -1,796 | -648 | -962 | -919 | 296 | 389 | 736 | 546 | 491 | 1,665 | -967 | -2,174 |
| 2018 | -1,416 | -293 | -734 | -462 | 644 | 963 | 957 | 77 | 295 | 1,493 | -469 | -1,891 |
| 2019 | -2,807 | -289 | 2,683 | 1,075 | 1,414 | -158 | 264 | -761 | -1,610 | 364 | -1,122 | -2,365 |
| 2020 | -2,035 | -1,017 | 428 | 435 | 483 | 422 | -100 | 663 | -304 | -1,094 | -848 | -1,584 |
| 2021 | -2,264 | 2,149 | 1,585 | 840 | 266 | -463 | 277 | -237 | -992 | -497 | -1,812 | -2,492 |
| 2022 | -3,138 | -2,011 | 462 | 631 | 440 | 5 | 11 | -350 | 269 | -817 | -1,185 | -2,281 |
| 2023 | -1,256 | -974 | 1,445 | 2,089 | 1,481 | 335 | 393 | -94 | 749 | 678 | -1,938 | -3,524 |
| 2024 | -2,405 | |||||||||||
| - = No Data Reported; -- = Not Applicable; NA = Not Available; W = Withheld to avoid disclosure of individual company data. |
| Release Date: 3/29/2024 |
| Next Release Date: 4/30/2024 |