|
Download Data (XLS File) |
|
||||||||
|
||||||||
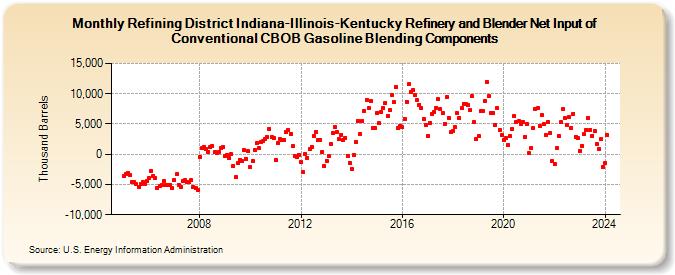
| Refining District Indiana-Illinois-Kentucky Refinery and Blender Net Input of Conventional CBOB Gasoline Blending Components (Thousand Barrels) | ||||||||
| Year | Jan | Feb | Mar | Apr | May | Jun | Jul | Aug | Sep | Oct | Nov | Dec |
|---|---|---|---|---|---|---|---|---|---|---|---|---|
| 2005 | -3,521 | -3,238 | -3,029 | -3,516 | -4,529 | -4,605 | -4,954 | -5,352 | -4,997 | -4,555 | -4,880 | -4,441 |
| 2006 | -3,962 | -2,803 | -3,539 | -3,958 | -5,548 | -5,229 | -5,111 | -4,431 | -5,118 | -5,136 | -5,126 | -5,648 |
| 2007 | -4,241 | -3,351 | -5,092 | -5,365 | -4,486 | -4,266 | -4,604 | -4,598 | -4,315 | -5,398 | -5,627 | -5,834 |
| 2008 | -497 | 948 | 1,240 | 875 | 345 | 1,134 | 1,349 | 333 | 200 | 410 | 988 | 1,208 |
| 2009 | -314 | -133 | -644 | -6 | -1,908 | -3,846 | -1,457 | -908 | -1,172 | 696 | -764 | 481 |
| 2010 | -2,162 | -1,094 | 701 | 1,839 | 953 | 2,026 | 2,136 | 2,558 | 2,837 | 4,172 | 2,784 | 2,659 |
| 2011 | -916 | 1,816 | 2,527 | 2,329 | 2,353 | 3,676 | 3,972 | 3,362 | 1,314 | -298 | -471 | -98 |
| 2012 | -1,292 | -2,989 | 98 | -551 | 887 | 1,208 | 2,988 | 3,661 | 2,303 | 2,351 | 423 | -1,959 |
| 2013 | -1,093 | -286 | 1,700 | 3,534 | 4,556 | 3,621 | 2,474 | 3,256 | 2,392 | 2,701 | -225 | -1,431 |
| 2014 | -2,413 | -133 | 2,054 | 5,560 | 3,383 | 5,532 | 7,215 | 8,961 | 7,577 | 8,752 | 4,415 | 4,314 |
| 2015 | 6,894 | 5,101 | 7,012 | 7,630 | 8,430 | 6,346 | 7,330 | 9,837 | 8,632 | 11,084 | 4,319 | 4,709 |
| 2016 | 4,423 | 5,881 | 8,687 | 11,550 | 10,333 | 10,638 | 9,734 | 8,891 | 8,196 | 7,673 | 5,814 | 4,856 |
| 2017 | 3,061 | 5,216 | 6,731 | 6,984 | 7,667 | 9,092 | 7,515 | 6,848 | 5,042 | 9,441 | 6,030 | 3,719 |
| 2018 | 3,888 | 4,451 | 6,733 | 6,038 | 7,593 | 8,305 | 8,296 | 8,188 | 7,283 | 9,575 | 5,271 | 2,512 |
| 2019 | 2,993 | 7,131 | 7,146 | 8,799 | 11,968 | 9,565 | 6,758 | 6,796 | 4,878 | 7,629 | 3,985 | 3,196 |
| 2020 | 2,307 | 2,700 | 1,529 | 2,977 | 4,197 | 6,312 | 5,260 | 5,411 | 5,056 | 5,362 | 2,917 | 4,922 |
| 2021 | 145 | 1,051 | 4,337 | 7,505 | 7,607 | 4,719 | 6,493 | 4,994 | 3,192 | 5,270 | 3,516 | -1,129 |
| 2022 | -1,682 | 979 | 3,051 | 5,280 | 7,395 | 6,021 | 4,899 | 6,133 | 4,307 | 6,729 | 2,922 | 2,608 |
| 2023 | 498 | 1,425 | 3,320 | 4,009 | 6,022 | 4,046 | 3,091 | 3,847 | 1,588 | 884 | 2,451 | -2,054 |
| 2024 | -1,416 | 3,218 | 1,188 | 4,888 | 4,071 | 1,961 | ||||||
| - = No Data Reported; -- = Not Applicable; NA = Not Available; W = Withheld to avoid disclosure of individual company data. |
| Release Date: 8/30/2024 |
| Next Release Date: 9/30/2024 |