|
Download Data (XLS File) |
|
||||||||
|
||||||||
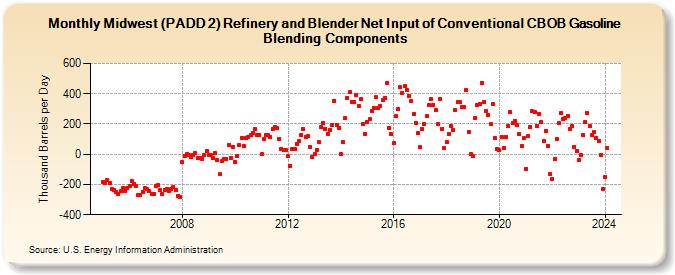
| Midwest (PADD 2) Refinery and Blender Net Input of Conventional CBOB Gasoline Blending Components (Thousand Barrels per Day) | ||||||||
| Year | Jan | Feb | Mar | Apr | May | Jun | Jul | Aug | Sep | Oct | Nov | Dec |
|---|---|---|---|---|---|---|---|---|---|---|---|---|
| 2005 | -184 | -189 | -170 | -192 | -231 | -238 | -248 | -263 | -245 | -226 | -240 | -224 |
| 2006 | -210 | -178 | -195 | -209 | -269 | -267 | -247 | -226 | -233 | -246 | -260 | -262 |
| 2007 | -208 | -202 | -236 | -262 | -235 | -229 | -245 | -230 | -216 | -237 | -273 | -281 |
| 2008 | -52 | -11 | 3 | -8 | -20 | -5 | 5 | -26 | -22 | -32 | -4 | 20 |
| 2009 | -3 | -6 | -24 | 8 | -39 | -134 | -46 | -31 | -30 | 59 | -22 | 49 |
| 2010 | -49 | -9 | 62 | 108 | 54 | 104 | 114 | 125 | 142 | 167 | 126 | 124 |
| 2011 | 1 | 102 | 127 | 125 | 117 | 169 | 182 | 172 | 101 | 36 | 28 | 29 |
| 2012 | -14 | -75 | 34 | 32 | 70 | 88 | 130 | 166 | 116 | 118 | 48 | -21 |
| 2013 | 0 | 29 | 84 | 179 | 209 | 168 | 137 | 161 | 195 | 352 | 196 | 171 |
| 2014 | 1 | 81 | 238 | 374 | 411 | 346 | 347 | 390 | 318 | 364 | 203 | 133 |
| 2015 | 216 | 230 | 288 | 307 | 376 | 303 | 320 | 359 | 372 | 470 | 172 | 131 |
| 2016 | 74 | 256 | 297 | 442 | 408 | 448 | 427 | 385 | 355 | 269 | 207 | 138 |
| 2017 | 45 | 166 | 200 | 256 | 323 | 364 | 326 | 290 | 203 | 367 | 170 | 44 |
| 2018 | 78 | 133 | 185 | 162 | 291 | 346 | 348 | 315 | 309 | 424 | 147 | 3 |
| 2019 | -12 | 241 | 323 | 334 | 473 | 347 | 289 | 260 | 198 | 331 | 104 | 37 |
| 2020 | 25 | 112 | 42 | 117 | 186 | 277 | 205 | 222 | 196 | 137 | 55 | 105 |
| 2021 | -96 | 120 | 181 | 284 | 280 | 188 | 267 | 211 | 89 | 155 | 57 | -130 |
| 2022 | -163 | -30 | 101 | 205 | 273 | 230 | 237 | 254 | 170 | 184 | 48 | 22 |
| 2023 | -39 | -8 | 127 | 211 | 272 | 186 | 128 | 146 | 107 | 86 | -6 | -227 |
| 2024 | -150 | 41 | -17 | 140 | 154 | 132 | ||||||
| - = No Data Reported; -- = Not Applicable; NA = Not Available; W = Withheld to avoid disclosure of individual company data. |
| Release Date: 8/30/2024 |
| Next Release Date: 9/30/2024 |