|
Download Data (XLS File) |
|
||||||||
|
||||||||
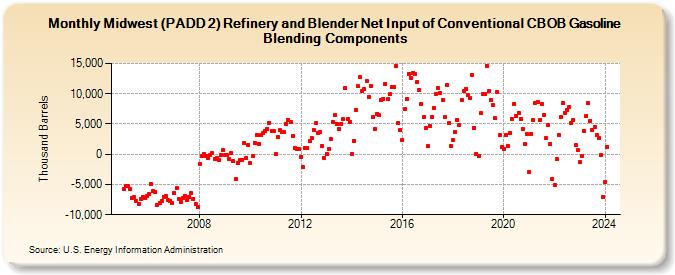
| Midwest (PADD 2) Refinery and Blender Net Input of Conventional CBOB Gasoline Blending Components (Thousand Barrels) | ||||||||
| Year | Jan | Feb | Mar | Apr | May | Jun | Jul | Aug | Sep | Oct | Nov | Dec |
|---|---|---|---|---|---|---|---|---|---|---|---|---|
| 2005 | -5,708 | -5,288 | -5,269 | -5,754 | -7,161 | -7,147 | -7,703 | -8,168 | -7,359 | -7,020 | -7,199 | -6,934 |
| 2006 | -6,496 | -4,971 | -6,056 | -6,280 | -8,332 | -8,013 | -7,662 | -6,998 | -6,981 | -7,627 | -7,809 | -8,136 |
| 2007 | -6,435 | -5,665 | -7,331 | -7,861 | -7,270 | -6,863 | -7,601 | -7,119 | -6,475 | -7,341 | -8,192 | -8,710 |
| 2008 | -1,619 | -310 | 105 | -227 | -607 | -141 | 144 | -811 | -672 | -993 | -115 | 618 |
| 2009 | -86 | -156 | -754 | 235 | -1,202 | -4,033 | -1,426 | -956 | -895 | 1,819 | -654 | 1,526 |
| 2010 | -1,509 | -245 | 1,909 | 3,225 | 1,676 | 3,118 | 3,540 | 3,885 | 4,248 | 5,168 | 3,785 | 3,834 |
| 2011 | 21 | 2,868 | 3,948 | 3,755 | 3,635 | 5,072 | 5,647 | 5,335 | 3,037 | 1,106 | 833 | 909 |
| 2012 | -423 | -2,174 | 1,049 | 955 | 2,172 | 2,637 | 4,026 | 5,154 | 3,483 | 3,657 | 1,430 | -647 |
| 2013 | 15 | 801 | 2,597 | 5,360 | 6,478 | 5,044 | 4,243 | 4,999 | 5,839 | 10,921 | 5,881 | 5,316 |
| 2014 | 43 | 2,256 | 7,365 | 11,224 | 12,743 | 10,374 | 10,750 | 12,092 | 9,529 | 11,288 | 6,079 | 4,130 |
| 2015 | 6,705 | 6,431 | 8,941 | 9,208 | 11,653 | 9,075 | 9,922 | 11,132 | 11,156 | 14,583 | 5,165 | 4,052 |
| 2016 | 2,298 | 7,431 | 9,195 | 13,252 | 12,663 | 13,441 | 13,251 | 11,929 | 10,636 | 8,353 | 6,213 | 4,269 |
| 2017 | 1,409 | 4,646 | 6,204 | 7,691 | 10,020 | 10,916 | 10,094 | 8,975 | 6,095 | 11,384 | 5,099 | 1,374 |
| 2018 | 2,403 | 3,712 | 5,727 | 4,864 | 9,024 | 10,373 | 10,782 | 9,760 | 9,279 | 13,148 | 4,396 | 82 |
| 2019 | -369 | 6,756 | 10,016 | 10,006 | 14,666 | 10,397 | 8,964 | 8,059 | 5,940 | 10,275 | 3,133 | 1,158 |
| 2020 | 788 | 3,251 | 1,311 | 3,517 | 5,765 | 8,324 | 6,346 | 6,889 | 5,870 | 4,233 | 1,652 | 3,265 |
| 2021 | -2,971 | 3,367 | 5,621 | 8,532 | 8,692 | 5,651 | 8,267 | 6,545 | 2,684 | 4,793 | 1,722 | -4,018 |
| 2022 | -5,048 | -835 | 3,125 | 6,141 | 8,457 | 6,893 | 7,358 | 7,885 | 5,090 | 5,701 | 1,452 | 671 |
| 2023 | -1,197 | -221 | 3,929 | 6,327 | 8,441 | 5,571 | 3,967 | 4,512 | 3,219 | 2,672 | -168 | -7,030 |
| 2024 | -4,654 | 1,190 | -530 | 4,209 | 4,765 | 3,947 | ||||||
| - = No Data Reported; -- = Not Applicable; NA = Not Available; W = Withheld to avoid disclosure of individual company data. |
| Release Date: 8/30/2024 |
| Next Release Date: 9/30/2024 |