|
Download Data (XLS File) |
|
||||||||
|
||||||||
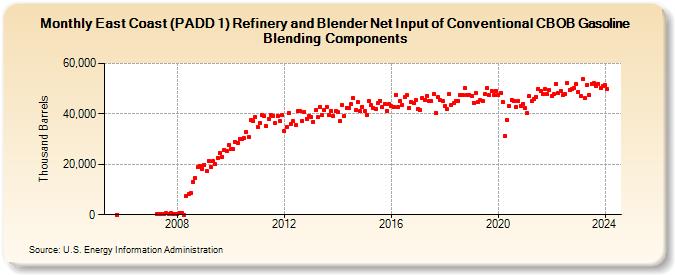
| East Coast (PADD 1) Refinery and Blender Net Input of Conventional CBOB Gasoline Blending Components (Thousand Barrels) | ||||||||
| Year | Jan | Feb | Mar | Apr | May | Jun | Jul | Aug | Sep | Oct | Nov | Dec |
|---|---|---|---|---|---|---|---|---|---|---|---|---|
| 2005 | 68 | |||||||||||
| 2007 | 395 | 480 | 462 | 475 | 499 | 458 | 485 | 445 | 451 | |||
| 2008 | 440 | 859 | 813 | 7 | 7,380 | 8,160 | 8,537 | 13,096 | 14,387 | 18,758 | 19,348 | 18,220 |
| 2009 | 19,830 | 17,422 | 21,321 | 19,106 | 21,124 | 19,998 | 22,608 | 24,385 | 23,061 | 25,778 | 25,227 | 27,639 |
| 2010 | 25,970 | 25,932 | 28,832 | 28,608 | 30,146 | 30,012 | 30,287 | 32,832 | 30,877 | 37,482 | 36,994 | 38,717 |
| 2011 | 34,702 | 36,474 | 39,538 | 39,182 | 35,114 | 37,990 | 39,427 | 39,268 | 36,198 | 39,356 | 37,304 | 39,382 |
| 2012 | 33,078 | 34,953 | 40,531 | 36,161 | 37,035 | 35,608 | 41,086 | 41,208 | 37,335 | 40,633 | 38,092 | 39,264 |
| 2013 | 38,639 | 36,818 | 41,422 | 38,608 | 42,628 | 39,384 | 41,512 | 42,839 | 39,677 | 40,982 | 39,043 | 41,130 |
| 2014 | 40,715 | 37,278 | 43,480 | 39,137 | 42,468 | 42,269 | 43,834 | 46,220 | 41,538 | 44,552 | 41,061 | 42,898 |
| 2015 | 41,333 | 39,715 | 44,940 | 43,375 | 42,185 | 41,900 | 44,279 | 45,277 | 42,547 | 44,069 | 41,107 | 44,058 |
| 2016 | 43,058 | 42,848 | 47,617 | 42,667 | 45,094 | 43,560 | 46,624 | 47,429 | 42,343 | 44,814 | 44,208 | 45,383 |
| 2017 | 41,768 | 41,613 | 46,410 | 45,579 | 47,189 | 44,944 | 45,127 | 47,831 | 40,383 | 46,542 | 45,399 | 44,931 |
| 2018 | 42,997 | 41,746 | 47,967 | 43,462 | 44,208 | 44,998 | 45,274 | 47,366 | 47,602 | 50,298 | 47,298 | 47,681 |
| 2019 | 46,924 | 44,477 | 48,296 | 44,900 | 45,508 | 45,041 | 47,861 | 50,409 | 47,388 | 49,142 | 47,332 | 49,213 |
| 2020 | 47,449 | 48,122 | 44,826 | 31,284 | 37,772 | 43,105 | 45,576 | 45,201 | 42,790 | 45,173 | 43,289 | 44,029 |
| 2021 | 42,232 | 40,349 | 46,966 | 45,005 | 46,038 | 46,831 | 50,038 | 49,051 | 47,997 | 49,776 | 47,812 | 49,450 |
| 2022 | 47,102 | 47,715 | 51,892 | 48,444 | 49,129 | 47,588 | 47,962 | 52,271 | 49,462 | 49,715 | 50,114 | 51,871 |
| 2023 | 48,773 | 47,040 | 53,775 | 46,236 | 51,477 | 47,521 | 51,989 | 52,215 | 51,032 | 52,032 | 50,312 | 50,884 |
| 2024 | 51,312 | |||||||||||
| - = No Data Reported; -- = Not Applicable; NA = Not Available; W = Withheld to avoid disclosure of individual company data. |
| Release Date: 3/29/2024 |
| Next Release Date: 4/30/2024 |