|
Download Data (XLS File) |
|
||||||||
|
||||||||
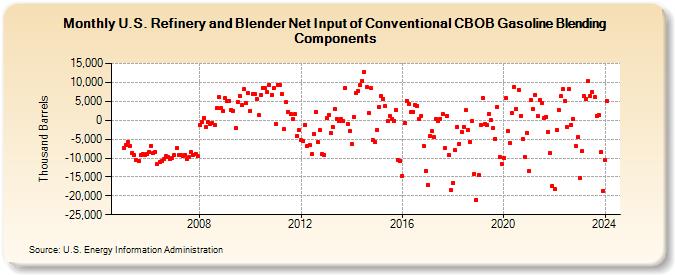
| U.S. Refinery and Blender Net Input of Conventional CBOB Gasoline Blending Components (Thousand Barrels) | ||||||||
| Year | Jan | Feb | Mar | Apr | May | Jun | Jul | Aug | Sep | Oct | Nov | Dec |
|---|---|---|---|---|---|---|---|---|---|---|---|---|
| 2005 | -7,347 | -6,490 | -5,737 | -6,795 | -8,571 | -9,171 | -10,480 | -10,883 | -9,270 | -8,875 | -9,087 | -8,835 |
| 2006 | -8,439 | -6,781 | -8,703 | -8,360 | -11,672 | -11,062 | -10,758 | -10,299 | -9,597 | -9,695 | -10,195 | -10,094 |
| 2007 | -9,221 | -7,414 | -9,292 | -9,305 | -9,481 | -9,193 | -10,284 | -9,780 | -8,538 | -9,205 | -8,871 | -9,552 |
| 2008 | -1,268 | -428 | 584 | -1,908 | -455 | -1,005 | -752 | -1,337 | 3,120 | 6,007 | 3,244 | 2,560 |
| 2009 | 5,767 | 5,083 | 5,200 | 2,770 | 2,433 | -2,068 | 4,874 | 6,411 | 4,059 | 8,128 | 4,427 | 7,161 |
| 2010 | 2,533 | 7,015 | 6,960 | 5,609 | 1,359 | 6,748 | 8,604 | 8,522 | 7,343 | 9,434 | 6,607 | 8,392 |
| 2011 | -946 | 9,422 | 9,340 | 6,870 | -2,450 | 4,691 | 2,240 | 1,517 | 326 | 1,630 | -4,093 | -2,664 |
| 2012 | -5,291 | -5,416 | -1,180 | -6,860 | -6,537 | -8,980 | -3,656 | 2,237 | -5,865 | -2,645 | -8,974 | -9,149 |
| 2013 | 611 | 1,482 | -3,326 | -1,684 | 2,872 | 208 | -327 | 228 | -207 | 8,460 | -1,080 | -2,882 |
| 2014 | -6,257 | 889 | 7,076 | 7,787 | 9,293 | 10,465 | 12,840 | 8,693 | 2,008 | 8,389 | -5,298 | -5,812 |
| 2015 | -2,508 | 3,495 | 6,318 | 5,670 | 3,652 | -250 | 1,080 | 363 | -86 | 2,826 | -10,581 | -10,879 |
| 2016 | -14,832 | -709 | 5,032 | 4,275 | 2,164 | 2,294 | 4,021 | 3,748 | 241 | 1,150 | -6,766 | -13,431 |
| 2017 | -17,059 | -4,080 | -2,841 | -4,520 | 340 | -119 | 404 | 1,539 | -7,408 | 1,221 | -9,253 | -18,443 |
| 2018 | -16,600 | -7,966 | -1,669 | -6,206 | -3,073 | -1,682 | 2,576 | -2,569 | -5,639 | -144 | -14,169 | -21,046 |
| 2019 | -14,430 | -1,264 | 5,919 | -1,048 | -1,255 | 1,659 | -48 | -2,038 | -4,891 | 3,424 | -9,698 | -11,713 |
| 2020 | -9,956 | 5,854 | -2,978 | -6,124 | 1,959 | 8,676 | 2,934 | 8,117 | 1,154 | -4,876 | -9,779 | -3,292 |
| 2021 | -13,511 | 5,443 | 2,908 | 6,778 | 1,156 | 5,355 | 4,505 | 484 | 798 | -3,252 | -8,687 | -17,295 |
| 2022 | -18,192 | -2,630 | 2,789 | 6,275 | 8,122 | 5,140 | -1,809 | 8,219 | -1,265 | 412 | -6,801 | -4,466 |
| 2023 | -15,299 | -8,278 | 6,453 | 5,558 | 10,430 | 6,366 | 7,473 | 6,198 | 1,121 | 1,370 | -8,493 | -18,612 |
| 2024 | -10,632 | |||||||||||
| - = No Data Reported; -- = Not Applicable; NA = Not Available; W = Withheld to avoid disclosure of individual company data. |
| Release Date: 3/29/2024 |
| Next Release Date: 4/30/2024 |