|
Download Data (XLS File) |
|
||||||||
|
||||||||
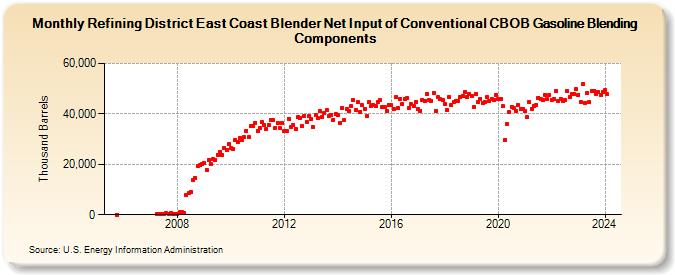
| Refining District East Coast Blender Net Input of Conventional CBOB Gasoline Blending Components (Thousand Barrels) | ||||||||
| Year | Jan | Feb | Mar | Apr | May | Jun | Jul | Aug | Sep | Oct | Nov | Dec |
|---|---|---|---|---|---|---|---|---|---|---|---|---|
| 2005 | 68 | |||||||||||
| 2007 | 395 | 480 | 462 | 475 | 499 | 458 | 485 | 445 | 451 | |||
| 2008 | 440 | 913 | 1,137 | 732 | 7,888 | 8,483 | 8,939 | 13,606 | 14,684 | 19,245 | 19,611 | 20,302 |
| 2009 | 20,414 | 17,646 | 21,608 | 20,094 | 22,014 | 21,873 | 23,886 | 24,993 | 23,757 | 26,430 | 25,681 | 27,945 |
| 2010 | 26,340 | 26,166 | 29,562 | 29,006 | 30,398 | 29,606 | 30,642 | 33,324 | 30,767 | 35,245 | 35,299 | 36,492 |
| 2011 | 33,196 | 34,329 | 36,633 | 35,768 | 33,852 | 35,582 | 37,775 | 37,420 | 34,417 | 36,396 | 34,518 | 36,308 |
| 2012 | 33,129 | 33,289 | 38,089 | 34,806 | 35,789 | 34,156 | 38,604 | 38,492 | 35,255 | 39,085 | 36,974 | 39,029 |
| 2013 | 37,958 | 34,645 | 39,396 | 38,179 | 40,958 | 38,905 | 40,249 | 41,513 | 39,136 | 39,736 | 37,730 | 39,966 |
| 2014 | 39,418 | 36,471 | 42,402 | 37,507 | 41,857 | 41,141 | 43,117 | 45,340 | 41,600 | 44,562 | 40,948 | 43,425 |
| 2015 | 42,122 | 39,087 | 44,673 | 43,040 | 43,461 | 42,943 | 44,732 | 45,452 | 42,566 | 42,824 | 41,140 | 43,545 |
| 2016 | 43,483 | 41,941 | 46,728 | 42,256 | 45,989 | 43,883 | 46,037 | 46,228 | 42,387 | 43,816 | 43,125 | 44,912 |
| 2017 | 41,779 | 41,280 | 45,700 | 44,996 | 48,003 | 45,578 | 45,225 | 48,380 | 41,157 | 46,547 | 45,744 | 45,578 |
| 2018 | 43,733 | 41,548 | 46,895 | 43,367 | 44,667 | 45,082 | 45,034 | 46,601 | 47,083 | 48,844 | 46,776 | 47,812 |
| 2019 | 46,990 | 42,782 | 47,885 | 44,639 | 45,963 | 44,273 | 44,701 | 46,781 | 45,073 | 46,000 | 45,431 | 47,528 |
| 2020 | 45,769 | 45,798 | 42,963 | 29,756 | 35,836 | 40,692 | 42,817 | 42,394 | 40,960 | 43,510 | 41,989 | 42,072 |
| 2021 | 41,103 | 38,633 | 44,890 | 42,107 | 43,093 | 43,609 | 46,413 | 45,742 | 45,656 | 47,682 | 45,775 | 47,482 |
| 2022 | 45,538 | 45,725 | 49,233 | 45,257 | 46,054 | 44,926 | 45,495 | 49,054 | 46,683 | 47,981 | 48,006 | 49,808 |
| 2023 | 47,597 | 44,878 | 51,810 | 44,457 | 48,460 | 44,693 | 48,992 | 49,194 | 48,026 | 48,754 | 47,678 | 48,489 |
| 2024 | 49,555 | 47,774 | ||||||||||
| - = No Data Reported; -- = Not Applicable; NA = Not Available; W = Withheld to avoid disclosure of individual company data. |
| Release Date: 4/30/2024 |
| Next Release Date: 5/31/2024 |