|
Download Data (XLS File) |
|
||||||||
|
||||||||
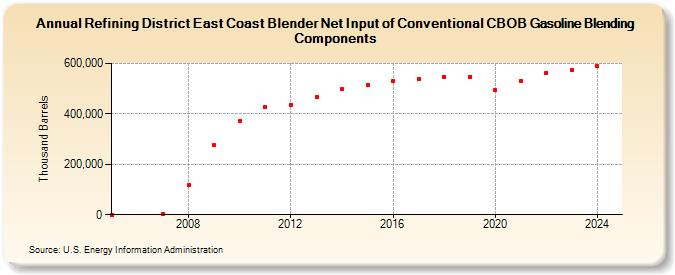
| Refining District East Coast Blender Net Input of Conventional CBOB Gasoline Blending Components (Thousand Barrels) | ||||||||
| Decade | Year-0 | Year-1 | Year-2 | Year-3 | Year-4 | Year-5 | Year-6 | Year-7 | Year-8 | Year-9 |
|---|---|---|---|---|---|---|---|---|---|---|
| 2000's | 68 | 4,150 | 115,980 | 276,341 | ||||||
| 2010's | 372,847 | 426,194 | 436,697 | 468,371 | 497,788 | 515,585 | 530,785 | 539,967 | 547,442 | 548,046 |
| 2020's | 494,556 | 532,185 | 563,760 | 573,028 |
| - = No Data Reported; -- = Not Applicable; NA = Not Available; W = Withheld to avoid disclosure of individual company data. |
| Release Date: 3/29/2024 |
| Next Release Date: 8/30/2024 |