|
Download Data (XLS File) |
|
||||||||
|
||||||||
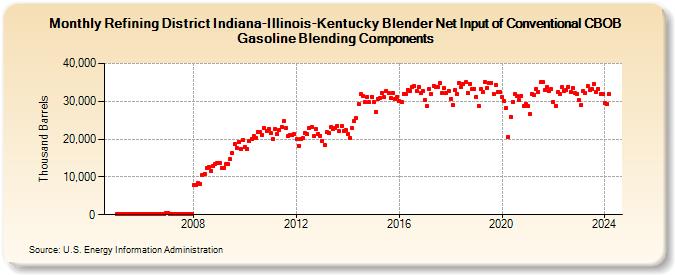
| Refining District Indiana-Illinois-Kentucky Blender Net Input of Conventional CBOB Gasoline Blending Components (Thousand Barrels) | ||||||||
| Year | Jan | Feb | Mar | Apr | May | Jun | Jul | Aug | Sep | Oct | Nov | Dec |
|---|---|---|---|---|---|---|---|---|---|---|---|---|
| 2005 | 163 | 154 | 164 | 143 | 152 | 184 | 180 | 196 | 161 | 154 | 166 | 197 |
| 2006 | 171 | 148 | 201 | 198 | 216 | 201 | 189 | 156 | 148 | 149 | 136 | 476 |
| 2007 | 423 | 320 | 247 | 177 | 192 | 232 | 253 | 280 | 240 | 241 | 302 | 251 |
| 2008 | 7,934 | 7,940 | 8,384 | 8,186 | 10,375 | 10,861 | 12,327 | 12,554 | 11,681 | 12,960 | 13,428 | 13,595 |
| 2009 | 13,641 | 12,345 | 12,375 | 13,328 | 13,483 | 14,630 | 16,272 | 18,674 | 17,740 | 19,207 | 17,509 | 19,729 |
| 2010 | 17,821 | 17,315 | 19,446 | 20,138 | 20,846 | 20,418 | 21,850 | 21,982 | 21,138 | 22,893 | 22,127 | 22,796 |
| 2011 | 21,583 | 19,940 | 22,661 | 21,462 | 22,288 | 23,261 | 24,688 | 22,860 | 20,774 | 21,161 | 20,974 | 21,329 |
| 2012 | 19,958 | 18,228 | 19,962 | 20,175 | 21,487 | 21,231 | 23,049 | 23,174 | 20,840 | 22,702 | 21,400 | 20,911 |
| 2013 | 19,510 | 18,525 | 21,811 | 21,641 | 23,089 | 22,675 | 23,021 | 23,569 | 22,061 | 23,376 | 22,217 | 22,372 |
| 2014 | 21,319 | 20,287 | 22,828 | 24,848 | 25,638 | 29,189 | 31,882 | 31,461 | 29,691 | 31,207 | 29,743 | 31,237 |
| 2015 | 29,849 | 27,205 | 30,618 | 30,829 | 32,287 | 31,022 | 32,800 | 32,285 | 30,805 | 32,244 | 30,632 | 31,203 |
| 2016 | 30,121 | 29,759 | 31,959 | 31,937 | 33,024 | 32,839 | 33,875 | 33,997 | 32,707 | 33,901 | 32,183 | 32,707 |
| 2017 | 30,406 | 28,628 | 33,253 | 32,019 | 34,074 | 33,689 | 33,791 | 34,822 | 32,148 | 33,475 | 32,321 | 32,845 |
| 2018 | 30,692 | 29,028 | 33,037 | 31,968 | 34,968 | 33,677 | 34,506 | 35,003 | 32,224 | 34,699 | 33,176 | 33,368 |
| 2019 | 31,255 | 28,767 | 33,151 | 32,533 | 35,132 | 33,586 | 34,734 | 34,919 | 32,027 | 34,389 | 32,402 | 32,454 |
| 2020 | 31,105 | 30,059 | 28,224 | 20,587 | 25,863 | 29,869 | 31,884 | 31,275 | 30,393 | 31,483 | 28,727 | 29,342 |
| 2021 | 28,789 | 26,689 | 31,969 | 31,702 | 33,335 | 32,412 | 35,024 | 35,163 | 32,905 | 33,767 | 32,625 | 33,200 |
| 2022 | 29,822 | 28,832 | 32,478 | 31,902 | 33,794 | 32,802 | 32,937 | 33,908 | 32,487 | 33,573 | 32,197 | 31,950 |
| 2023 | 30,329 | 29,065 | 32,643 | 32,144 | 34,102 | 33,011 | 33,364 | 34,677 | 32,493 | 33,346 | 31,910 | 31,983 |
| 2024 | 29,549 | 29,158 | ||||||||||
| - = No Data Reported; -- = Not Applicable; NA = Not Available; W = Withheld to avoid disclosure of individual company data. |
| Release Date: 4/30/2024 |
| Next Release Date: 5/31/2024 |