|
Download Data (XLS File) |
|
||||||||
|
||||||||
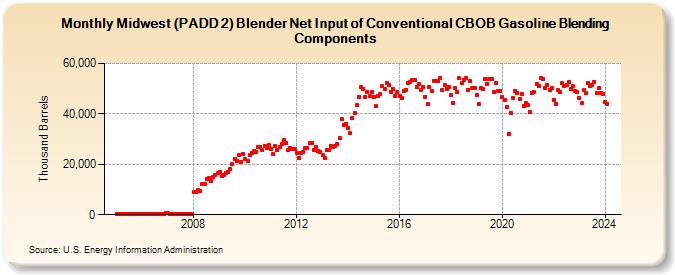
| Midwest (PADD 2) Blender Net Input of Conventional CBOB Gasoline Blending Components (Thousand Barrels) | ||||||||
| Year | Jan | Feb | Mar | Apr | May | Jun | Jul | Aug | Sep | Oct | Nov | Dec |
|---|---|---|---|---|---|---|---|---|---|---|---|---|
| 2005 | 254 | 236 | 260 | 251 | 256 | 293 | 293 | 299 | 262 | 285 | 276 | 322 |
| 2006 | 275 | 254 | 292 | 298 | 322 | 271 | 241 | 254 | 250 | 237 | 223 | 576 |
| 2007 | 522 | 407 | 323 | 257 | 249 | 289 | 311 | 347 | 297 | 325 | 372 | 305 |
| 2008 | 9,201 | 9,186 | 9,704 | 9,510 | 12,169 | 12,237 | 14,192 | 14,616 | 13,537 | 14,884 | 15,927 | 16,395 |
| 2009 | 17,104 | 15,391 | 15,708 | 16,670 | 16,982 | 18,039 | 19,973 | 22,086 | 21,234 | 23,749 | 20,983 | 24,105 |
| 2010 | 22,023 | 21,281 | 23,852 | 24,548 | 25,267 | 24,772 | 26,881 | 26,767 | 25,482 | 27,335 | 26,638 | 27,479 |
| 2011 | 26,027 | 24,080 | 27,113 | 25,672 | 26,998 | 27,910 | 29,790 | 28,300 | 25,729 | 26,536 | 26,017 | 26,193 |
| 2012 | 24,466 | 22,505 | 24,456 | 24,926 | 26,358 | 26,457 | 28,333 | 28,597 | 25,796 | 27,037 | 25,450 | 25,035 |
| 2013 | 23,609 | 22,314 | 25,832 | 25,594 | 27,361 | 26,805 | 27,459 | 28,069 | 30,514 | 37,824 | 35,713 | 36,173 |
| 2014 | 34,345 | 32,303 | 38,307 | 40,448 | 43,350 | 46,834 | 50,592 | 49,976 | 46,736 | 48,724 | 46,918 | 48,759 |
| 2015 | 46,896 | 42,992 | 47,144 | 47,864 | 50,932 | 50,073 | 52,402 | 51,439 | 48,598 | 49,863 | 47,253 | 48,760 |
| 2016 | 47,033 | 46,164 | 49,214 | 49,666 | 52,334 | 52,530 | 53,433 | 53,530 | 50,700 | 51,953 | 49,601 | 50,680 |
| 2017 | 46,725 | 43,826 | 50,865 | 48,920 | 53,051 | 52,908 | 52,922 | 54,318 | 49,320 | 51,299 | 49,738 | 50,516 |
| 2018 | 47,358 | 44,450 | 50,207 | 48,623 | 54,097 | 52,449 | 53,549 | 54,132 | 49,484 | 52,907 | 50,380 | 50,340 |
| 2019 | 47,479 | 43,728 | 50,181 | 49,760 | 53,963 | 51,738 | 54,003 | 54,006 | 48,864 | 52,365 | 49,267 | 49,174 |
| 2020 | 46,872 | 45,380 | 42,813 | 32,046 | 40,470 | 46,309 | 49,202 | 48,411 | 46,081 | 47,717 | 43,063 | 44,147 |
| 2021 | 43,399 | 40,620 | 48,343 | 48,522 | 51,904 | 51,148 | 54,249 | 54,026 | 50,367 | 51,410 | 49,607 | 50,336 |
| 2022 | 45,595 | 43,856 | 49,561 | 48,630 | 52,445 | 51,106 | 51,598 | 52,667 | 49,941 | 51,038 | 49,006 | 48,621 |
| 2023 | 46,311 | 44,264 | 49,437 | 48,131 | 52,168 | 51,227 | 51,378 | 52,694 | 48,429 | 50,351 | 48,347 | 47,792 |
| 2024 | 44,718 | 44,096 | ||||||||||
| - = No Data Reported; -- = Not Applicable; NA = Not Available; W = Withheld to avoid disclosure of individual company data. |
| Release Date: 4/30/2024 |
| Next Release Date: 5/31/2024 |