|
Download Data (XLS File) |
|
||||||||
|
||||||||
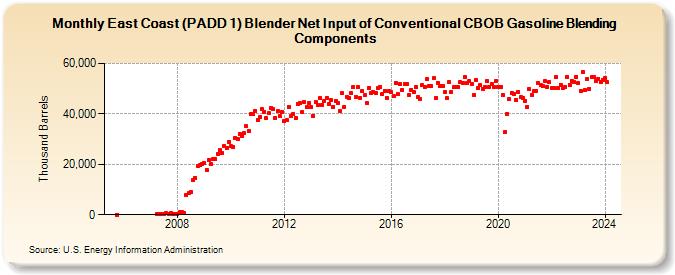
| East Coast (PADD 1) Blender Net Input of Conventional CBOB Gasoline Blending Components (Thousand Barrels) | ||||||||
| Year | Jan | Feb | Mar | Apr | May | Jun | Jul | Aug | Sep | Oct | Nov | Dec |
|---|---|---|---|---|---|---|---|---|---|---|---|---|
| 2005 | 68 | |||||||||||
| 2007 | 395 | 480 | 462 | 475 | 499 | 458 | 485 | 445 | 451 | |||
| 2008 | 440 | 913 | 1,137 | 732 | 7,888 | 8,483 | 8,939 | 13,606 | 14,684 | 19,245 | 19,611 | 20,302 |
| 2009 | 20,414 | 17,646 | 21,608 | 20,094 | 22,014 | 21,939 | 24,099 | 25,762 | 24,464 | 27,248 | 26,436 | 28,756 |
| 2010 | 27,217 | 27,005 | 30,513 | 30,120 | 32,034 | 31,190 | 32,363 | 35,095 | 33,368 | 40,042 | 39,843 | 41,179 |
| 2011 | 37,662 | 38,583 | 41,801 | 40,836 | 38,258 | 40,186 | 42,522 | 41,892 | 38,455 | 40,991 | 38,991 | 40,693 |
| 2012 | 37,082 | 37,447 | 42,916 | 39,044 | 40,022 | 38,446 | 44,020 | 44,204 | 40,583 | 44,819 | 42,631 | 44,246 |
| 2013 | 42,585 | 39,311 | 44,775 | 43,648 | 46,160 | 43,697 | 45,287 | 46,352 | 44,014 | 45,439 | 42,852 | 45,040 |
| 2014 | 44,381 | 41,065 | 48,100 | 42,817 | 46,829 | 46,290 | 48,174 | 50,693 | 46,802 | 50,478 | 46,439 | 49,043 |
| 2015 | 47,333 | 44,308 | 50,398 | 48,428 | 48,845 | 48,342 | 50,078 | 50,838 | 47,913 | 49,117 | 46,427 | 49,134 |
| 2016 | 48,518 | 46,966 | 52,378 | 47,757 | 51,674 | 49,604 | 51,682 | 51,996 | 47,644 | 49,629 | 48,702 | 50,652 |
| 2017 | 46,775 | 45,978 | 51,284 | 50,623 | 53,736 | 51,165 | 51,089 | 54,089 | 46,390 | 52,317 | 51,134 | 51,188 |
| 2018 | 48,662 | 46,189 | 52,520 | 48,790 | 50,500 | 50,686 | 50,680 | 52,475 | 52,373 | 54,481 | 52,175 | 53,062 |
| 2019 | 52,041 | 47,568 | 53,351 | 50,099 | 51,320 | 50,074 | 50,654 | 53,120 | 50,725 | 51,753 | 50,855 | 53,020 |
| 2020 | 50,820 | 50,708 | 47,461 | 32,703 | 40,096 | 45,786 | 48,227 | 47,810 | 45,614 | 48,715 | 46,509 | 46,339 |
| 2021 | 45,263 | 42,817 | 49,935 | 47,510 | 48,923 | 49,140 | 52,275 | 51,314 | 50,963 | 53,045 | 50,745 | 52,647 |
| 2022 | 50,088 | 50,238 | 54,585 | 50,466 | 51,574 | 50,291 | 50,729 | 54,639 | 51,660 | 53,152 | 52,797 | 54,758 |
| 2023 | 52,167 | 49,202 | 56,667 | 49,379 | 53,937 | 50,000 | 54,508 | 54,785 | 53,196 | 54,001 | 52,713 | 53,469 |
| 2024 | 54,086 | 52,464 | ||||||||||
| - = No Data Reported; -- = Not Applicable; NA = Not Available; W = Withheld to avoid disclosure of individual company data. |
| Release Date: 4/30/2024 |
| Next Release Date: 5/31/2024 |