|
Download Data (XLS File) |
|
||||||||
|
||||||||
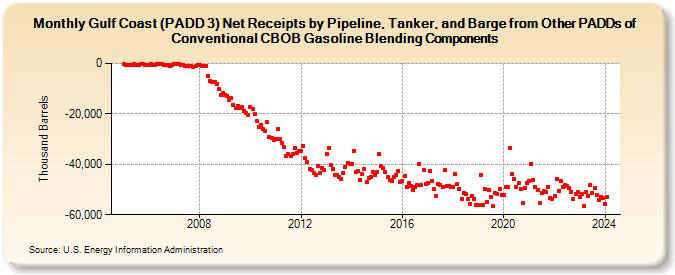
| Gulf Coast (PADD 3) Net Receipts by Pipeline, Tanker, and Barge from Other PADDs of Conventional CBOB Gasoline Blending Components (Thousand Barrels) | ||||||||
| Year | Jan | Feb | Mar | Apr | May | Jun | Jul | Aug | Sep | Oct | Nov | Dec |
|---|---|---|---|---|---|---|---|---|---|---|---|---|
| 2005 | -366 | -446 | -508 | -520 | -537 | -240 | -766 | -738 | -362 | -289 | -585 | -514 |
| 2006 | -479 | -292 | -539 | -493 | -49 | -200 | -178 | -600 | -524 | -775 | -1,084 | -536 |
| 2007 | -179 | -348 | -190 | -689 | -684 | -1,155 | -846 | -817 | -905 | -1,217 | -1,149 | -800 |
| 2008 | -657 | -854 | -1,111 | -1,156 | -4,866 | -6,769 | -7,253 | -7,198 | -8,177 | -10,284 | -12,629 | -11,847 |
| 2009 | -12,342 | -12,818 | -14,454 | -13,582 | -16,542 | -17,784 | -16,720 | -17,797 | -17,198 | -18,877 | -19,667 | -20,510 |
| 2010 | -17,118 | -17,902 | -20,041 | -22,810 | -25,287 | -24,226 | -25,936 | -26,911 | -23,373 | -29,284 | -29,433 | -30,349 |
| 2011 | -29,795 | -26,126 | -30,011 | -31,549 | -33,060 | -36,537 | -36,004 | -36,892 | -35,782 | -33,454 | -35,410 | -34,726 |
| 2012 | -34,611 | -32,546 | -37,406 | -39,280 | -41,675 | -42,315 | -43,371 | -44,224 | -40,735 | -43,592 | -41,487 | -42,189 |
| 2013 | -36,095 | -33,354 | -40,270 | -41,902 | -44,372 | -44,209 | -45,075 | -45,708 | -43,423 | -40,934 | -39,471 | -39,932 |
| 2014 | -40,062 | -34,821 | -43,107 | -42,544 | -46,065 | -43,746 | -41,907 | -47,095 | -45,245 | -45,117 | -43,206 | -44,226 |
| 2015 | -42,935 | -35,987 | -40,817 | -41,483 | -43,048 | -45,069 | -46,117 | -46,589 | -44,850 | -44,297 | -42,468 | -46,840 |
| 2016 | -46,651 | -44,679 | -48,966 | -47,271 | -48,505 | -50,023 | -49,184 | -48,351 | -39,827 | -48,399 | -42,071 | -47,960 |
| 2017 | -47,467 | -42,505 | -46,746 | -49,890 | -52,671 | -47,793 | -48,071 | -49,151 | -42,432 | -48,693 | -48,675 | -49,193 |
| 2018 | -48,807 | -43,835 | -47,953 | -49,729 | -53,643 | -51,229 | -51,697 | -53,853 | -55,823 | -52,454 | -53,937 | -56,303 |
| 2019 | -56,004 | -44,193 | -56,044 | -49,883 | -54,813 | -50,194 | -53,055 | -56,677 | -51,305 | -51,602 | -49,993 | -52,155 |
| 2020 | -52,289 | -48,927 | -49,089 | -33,642 | -44,028 | -45,807 | -49,166 | -47,477 | -49,864 | -55,207 | -49,219 | -47,539 |
| 2021 | -46,797 | -39,781 | -46,298 | -49,113 | -50,109 | -55,424 | -51,468 | -50,579 | -51,007 | -49,071 | -53,278 | -53,961 |
| 2022 | -52,623 | -45,753 | -50,497 | -46,745 | -49,170 | -48,384 | -48,666 | -49,364 | -50,862 | -53,841 | -51,804 | -51,057 |
| 2023 | -52,831 | -51,636 | -56,677 | -51,028 | -52,578 | -48,379 | -51,440 | -49,451 | -51,998 | -54,108 | -52,949 | -53,552 |
| 2024 | -55,562 | |||||||||||
| - = No Data Reported; -- = Not Applicable; NA = Not Available; W = Withheld to avoid disclosure of individual company data. |
| Release Date: 3/29/2024 |
| Next Release Date: 4/30/2024 |
Referring Pages: