|
Download Data (XLS File) |
|
||||||||
|
||||||||
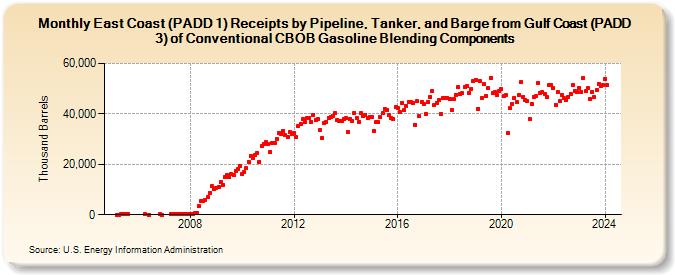
| East Coast (PADD 1) Receipts by Pipeline, Tanker, and Barge from Gulf Coast (PADD 3) of Conventional CBOB Gasoline Blending Components (Thousand Barrels) | ||||||||
| Year | Jan | Feb | Mar | Apr | May | Jun | Jul | Aug | Sep | Oct | Nov | Dec |
|---|---|---|---|---|---|---|---|---|---|---|---|---|
| 2005 | 74 | 50 | 134 | 130 | 326 | 206 | ||||||
| 2006 | 301 | 50 | 99 | 30 | ||||||||
| 2007 | 348 | 359 | 419 | 299 | 465 | 305 | 444 | 413 | 363 | |||
| 2008 | 396 | 406 | 524 | 617 | 3,438 | 5,433 | 5,614 | 5,929 | 6,990 | 8,792 | 11,260 | 10,297 |
| 2009 | 10,493 | 11,184 | 12,804 | 11,798 | 15,084 | 15,691 | 14,966 | 16,032 | 15,600 | 17,320 | 17,943 | 19,139 |
| 2010 | 16,248 | 16,910 | 18,408 | 21,078 | 23,403 | 22,620 | 23,614 | 24,525 | 21,036 | 27,340 | 28,009 | 28,745 |
| 2011 | 28,242 | 24,949 | 28,337 | 28,589 | 30,066 | 32,529 | 32,158 | 33,335 | 31,612 | 30,745 | 32,828 | 32,194 |
| 2012 | 32,349 | 30,774 | 35,098 | 36,092 | 37,828 | 36,779 | 38,452 | 38,512 | 36,867 | 39,666 | 37,720 | 37,966 |
| 2013 | 33,692 | 30,575 | 36,502 | 36,920 | 38,384 | 38,784 | 39,294 | 40,433 | 37,664 | 37,365 | 37,350 | 38,052 |
| 2014 | 38,180 | 32,910 | 37,891 | 37,084 | 40,322 | 38,323 | 36,970 | 40,240 | 39,110 | 39,727 | 38,189 | 38,829 |
| 2015 | 38,816 | 33,218 | 36,747 | 36,654 | 38,585 | 40,213 | 42,019 | 41,561 | 39,649 | 38,445 | 37,969 | 42,726 |
| 2016 | 42,391 | 40,775 | 44,420 | 41,633 | 43,158 | 44,769 | 44,679 | 44,226 | 35,755 | 44,928 | 39,065 | 44,791 |
| 2017 | 43,958 | 40,086 | 44,654 | 46,813 | 48,938 | 43,512 | 44,284 | 45,620 | 40,107 | 46,146 | 46,302 | 46,439 |
| 2018 | 45,866 | 41,641 | 45,861 | 47,606 | 50,537 | 47,925 | 48,140 | 50,650 | 50,957 | 48,479 | 50,034 | 52,867 |
| 2019 | 53,543 | 42,095 | 53,107 | 46,338 | 51,702 | 47,130 | 50,114 | 54,341 | 48,330 | 48,503 | 47,386 | 49,195 |
| 2020 | 49,798 | 46,940 | 47,323 | 32,352 | 42,147 | 44,006 | 46,466 | 44,629 | 47,418 | 52,604 | 46,801 | 45,646 |
| 2021 | 45,048 | 37,947 | 44,047 | 46,810 | 47,014 | 52,386 | 48,402 | 48,690 | 47,999 | 46,769 | 51,395 | 51,506 |
| 2022 | 50,206 | 43,644 | 48,672 | 45,271 | 47,665 | 46,139 | 45,615 | 46,603 | 47,940 | 51,279 | 48,892 | 48,538 |
| 2023 | 50,283 | 48,835 | 54,244 | 48,921 | 50,117 | 45,986 | 48,698 | 46,527 | 49,439 | 52,016 | 50,985 | 51,481 |
| 2024 | 53,843 | 51,377 | 53,107 | 47,789 | 49,891 | 45,637 | ||||||
| - = No Data Reported; -- = Not Applicable; NA = Not Available; W = Withheld to avoid disclosure of individual company data. |
| Release Date: 8/30/2024 |
| Next Release Date: 9/30/2024 |