|
Download Data (XLS File) |
|
||||||||
|
||||||||
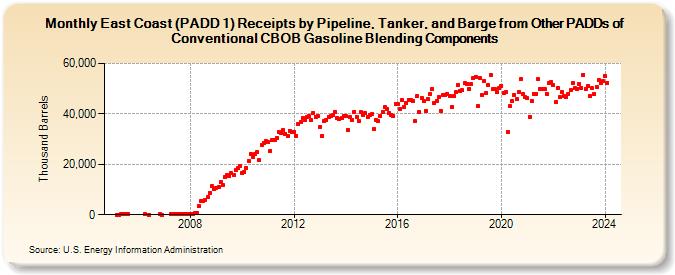
| East Coast (PADD 1) Receipts by Pipeline, Tanker, and Barge from Other PADDs of Conventional CBOB Gasoline Blending Components (Thousand Barrels) | ||||||||
| Year | Jan | Feb | Mar | Apr | May | Jun | Jul | Aug | Sep | Oct | Nov | Dec |
|---|---|---|---|---|---|---|---|---|---|---|---|---|
| 2005 | 74 | 50 | 134 | 130 | 326 | 206 | ||||||
| 2006 | 301 | 50 | 99 | 30 | ||||||||
| 2007 | 348 | 359 | 419 | 299 | 465 | 305 | 444 | 413 | 363 | |||
| 2008 | 396 | 406 | 524 | 617 | 3,438 | 5,433 | 5,614 | 5,929 | 6,990 | 8,792 | 11,285 | 10,297 |
| 2009 | 10,493 | 11,184 | 12,804 | 11,798 | 15,084 | 15,868 | 15,226 | 16,442 | 15,920 | 17,657 | 18,412 | 19,478 |
| 2010 | 16,476 | 17,102 | 18,677 | 21,434 | 24,114 | 22,946 | 24,017 | 24,839 | 21,605 | 27,724 | 28,465 | 29,234 |
| 2011 | 28,761 | 25,375 | 29,786 | 29,493 | 30,478 | 33,009 | 32,566 | 33,694 | 32,210 | 31,220 | 33,337 | 32,892 |
| 2012 | 32,885 | 31,414 | 35,939 | 36,671 | 38,406 | 37,463 | 38,900 | 39,008 | 37,503 | 40,474 | 38,876 | 39,006 |
| 2013 | 34,848 | 31,406 | 37,122 | 37,570 | 38,865 | 39,209 | 39,708 | 40,895 | 38,369 | 38,030 | 38,303 | 39,189 |
| 2014 | 39,285 | 33,753 | 38,572 | 37,622 | 40,856 | 38,809 | 37,354 | 40,636 | 39,516 | 40,324 | 38,880 | 39,610 |
| 2015 | 39,845 | 34,087 | 37,548 | 37,173 | 39,109 | 40,697 | 42,582 | 42,021 | 40,289 | 39,522 | 39,102 | 44,122 |
| 2016 | 43,810 | 41,903 | 45,602 | 42,640 | 44,173 | 45,629 | 45,563 | 45,195 | 36,998 | 47,080 | 40,752 | 46,390 |
| 2017 | 45,181 | 41,232 | 45,848 | 47,907 | 50,069 | 44,466 | 45,217 | 46,636 | 41,092 | 47,464 | 47,569 | 47,994 |
| 2018 | 47,192 | 42,737 | 47,054 | 48,585 | 51,599 | 48,889 | 49,377 | 52,121 | 52,018 | 49,855 | 51,670 | 54,081 |
| 2019 | 54,802 | 43,204 | 54,269 | 47,617 | 53,012 | 48,290 | 51,350 | 55,593 | 49,690 | 49,736 | 48,611 | 50,288 |
| 2020 | 51,066 | 48,322 | 48,621 | 32,944 | 42,992 | 45,186 | 47,625 | 45,780 | 48,581 | 53,690 | 47,870 | 46,694 |
| 2021 | 46,139 | 38,911 | 45,279 | 48,014 | 48,036 | 53,648 | 49,826 | 50,021 | 49,721 | 48,072 | 52,419 | 52,736 |
| 2022 | 51,338 | 44,729 | 50,178 | 46,579 | 48,773 | 47,237 | 46,655 | 48,070 | 49,355 | 52,314 | 50,169 | 50,013 |
| 2023 | 51,964 | 50,174 | 55,548 | 49,990 | 51,166 | 47,191 | 50,127 | 47,988 | 50,848 | 53,420 | 52,251 | 52,997 |
| 2024 | 54,963 | |||||||||||
| - = No Data Reported; -- = Not Applicable; NA = Not Available; W = Withheld to avoid disclosure of individual company data. |
| Release Date: 3/29/2024 |
| Next Release Date: 4/30/2024 |
Referring Pages: