|
Download Data (XLS File) |
|
||||||||
|
||||||||
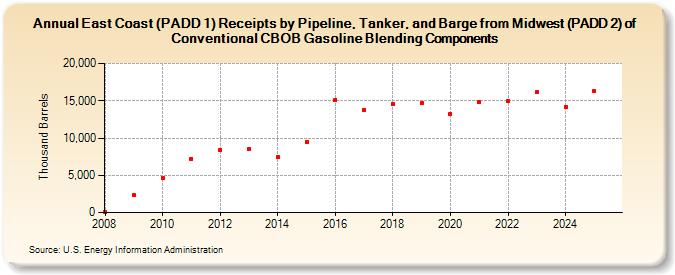
| East Coast (PADD 1) Receipts by Pipeline, Tanker, and Barge from Midwest (PADD 2) of Conventional CBOB Gasoline Blending Components (Thousand Barrels) | ||||||||
| Decade | Year-0 | Year-1 | Year-2 | Year-3 | Year-4 | Year-5 | Year-6 | Year-7 | Year-8 | Year-9 |
|---|---|---|---|---|---|---|---|---|---|---|
| 2000's | 25 | 2,312 | ||||||||
| 2010's | 4,697 | 7,237 | 8,442 | 8,499 | 7,442 | 9,495 | 15,145 | 13,816 | 14,615 | 14,678 |
| 2020's | 13,241 | 14,809 | 14,946 | 16,132 |
| - = No Data Reported; -- = Not Applicable; NA = Not Available; W = Withheld to avoid disclosure of individual company data. |
| Release Date: 8/30/2024 |
| Next Release Date: 8/29/2025 |