|
Download Data (XLS File) |
|
||||||||
|
||||||||
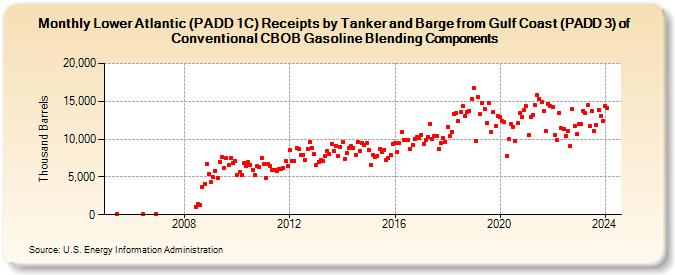
| Lower Atlantic (PADD 1C) Receipts by Tanker and Barge from Gulf Coast (PADD 3) of Conventional CBOB Gasoline Blending Components (Thousand Barrels) | ||||||||
| Year | Jan | Feb | Mar | Apr | May | Jun | Jul | Aug | Sep | Oct | Nov | Dec |
|---|---|---|---|---|---|---|---|---|---|---|---|---|
| 2005 | 130 | |||||||||||
| 2006 | 50 | 30 | ||||||||||
| 2008 | 1,004 | 1,433 | 1,235 | 3,682 | 4,071 | 6,682 | 5,418 | |||||
| 2009 | 4,292 | 4,937 | 5,810 | 4,920 | 7,014 | 7,583 | 6,226 | 7,461 | 6,625 | 7,467 | 6,881 | 7,101 |
| 2010 | 5,239 | 5,689 | 5,262 | 6,799 | 6,418 | 6,947 | 6,630 | 5,972 | 5,228 | 6,432 | 6,272 | 7,515 |
| 2011 | 6,748 | 4,864 | 6,770 | 6,462 | 5,907 | 5,979 | 5,796 | 6,086 | 6,095 | 6,182 | 7,143 | 6,434 |
| 2012 | 8,572 | 7,147 | 7,166 | 8,827 | 8,656 | 7,936 | 7,875 | 7,257 | 8,720 | 9,672 | 8,799 | 7,969 |
| 2013 | 6,537 | 7,010 | 7,270 | 7,039 | 7,716 | 8,396 | 7,995 | 9,388 | 8,424 | 9,150 | 7,745 | 9,013 |
| 2014 | 9,572 | 7,365 | 8,111 | 8,759 | 9,034 | 8,822 | 7,875 | 9,618 | 8,371 | 9,472 | 9,228 | 9,471 |
| 2015 | 8,559 | 6,616 | 7,949 | 7,686 | 7,745 | 8,703 | 8,301 | 8,594 | 7,279 | 7,518 | 7,913 | 9,378 |
| 2016 | 9,479 | 8,303 | 9,440 | 10,912 | 9,941 | 9,936 | 9,924 | 8,684 | 9,252 | 9,982 | 10,224 | 10,131 |
| 2017 | 10,519 | 9,402 | 9,871 | 10,330 | 12,018 | 10,077 | 10,429 | 10,466 | 8,630 | 9,505 | 10,136 | 9,620 |
| 2018 | 11,596 | 10,439 | 10,991 | 13,375 | 13,403 | 12,381 | 13,566 | 14,350 | 13,088 | 13,644 | 13,755 | 15,298 |
| 2019 | 16,752 | 9,697 | 15,519 | 13,307 | 14,713 | 13,979 | 12,124 | 14,793 | 10,904 | 13,620 | 11,749 | 13,041 |
| 2020 | 12,860 | 12,410 | 12,215 | 7,735 | 9,952 | 11,962 | 11,600 | 9,729 | 12,091 | 13,405 | 12,902 | 13,892 |
| 2021 | 14,318 | 10,563 | 12,874 | 13,252 | 14,450 | 15,812 | 15,313 | 14,899 | 13,704 | 11,008 | 14,642 | 14,370 |
| 2022 | 14,309 | 10,482 | 9,920 | 13,493 | 11,429 | 11,293 | 10,424 | 11,012 | 9,029 | 13,938 | 11,748 | 10,642 |
| 2023 | 11,950 | 11,952 | 13,739 | 13,437 | 14,447 | 11,709 | 13,714 | 11,084 | 11,886 | 13,871 | 13,004 | 12,389 |
| 2024 | 14,390 | 14,055 | ||||||||||
| - = No Data Reported; -- = Not Applicable; NA = Not Available; W = Withheld to avoid disclosure of individual company data. |
| Release Date: 4/30/2024 |
| Next Release Date: 5/31/2024 |