|
Download Data (XLS File) |
|
||||||||
|
||||||||
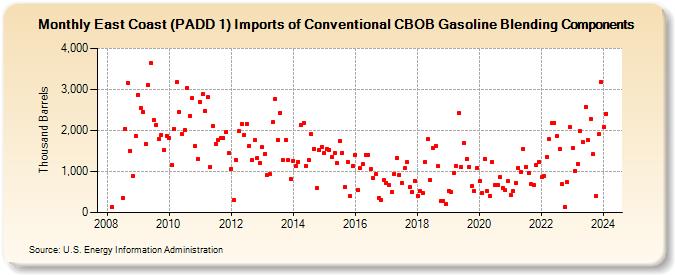
| East Coast (PADD 1) Imports of Conventional CBOB Gasoline Blending Components (Thousand Barrels) | ||||||||
| Year | Jan | Feb | Mar | Apr | May | Jun | Jul | Aug | Sep | Oct | Nov | Dec |
|---|---|---|---|---|---|---|---|---|---|---|---|---|
| 2008 | 135 | 350 | 2,042 | 3,162 | 1,508 | 899 | 1,865 | |||||
| 2009 | 2,876 | 2,544 | 2,455 | 1,682 | 3,104 | 3,642 | 2,261 | 2,136 | 1,793 | 1,899 | 1,530 | 1,876 |
| 2010 | 1,825 | 1,170 | 2,038 | 3,170 | 2,459 | 1,920 | 2,007 | 3,044 | 2,360 | 2,790 | 1,614 | 1,310 |
| 2011 | 2,703 | 2,888 | 2,476 | 2,808 | 1,120 | 2,102 | 1,677 | 1,769 | 1,808 | 1,811 | 1,959 | 1,449 |
| 2012 | 1,062 | 307 | 1,285 | 1,984 | 2,155 | 1,899 | 2,167 | 1,625 | 1,283 | 1,759 | 1,323 | 1,210 |
| 2013 | 1,590 | 1,438 | 924 | 929 | 2,195 | 2,777 | 1,762 | 2,437 | 1,270 | 1,768 | 1,273 | 822 |
| 2014 | 1,258 | 1,127 | 1,244 | 2,123 | 2,192 | 1,144 | 1,281 | 1,912 | 1,552 | 593 | 1,525 | 1,600 |
| 2015 | 1,459 | 1,550 | 1,525 | 1,350 | 1,450 | 1,199 | 1,742 | 1,462 | 611 | 1,237 | 401 | 1,140 |
| 2016 | 1,409 | 547 | 1,075 | 1,172 | 1,413 | 1,412 | 1,054 | 836 | 932 | 364 | 300 | 784 |
| 2017 | 724 | 675 | 505 | 935 | 1,329 | 910 | 729 | 1,074 | 1,229 | 616 | 500 | 778 |
| 2018 | 413 | 515 | 465 | 1,236 | 1,790 | 793 | 1,574 | 1,633 | 1,125 | 270 | 286 | 220 |
| 2019 | 537 | 500 | 959 | 1,145 | 2,416 | 1,103 | 1,686 | 1,310 | 1,118 | 641 | 520 | 1,092 |
| 2020 | 759 | 483 | 1,317 | 514 | 415 | 1,237 | 673 | 682 | 867 | 607 | 543 | 767 |
| 2021 | 426 | 521 | 725 | 1,093 | 991 | 1,551 | 1,120 | 965 | 694 | 670 | 1,154 | 1,227 |
| 2022 | 860 | 888 | 1,355 | 1,782 | 2,173 | 2,193 | 1,866 | 1,555 | 689 | 130 | 741 | 2,079 |
| 2023 | 1,572 | 1,016 | 1,194 | 1,983 | 1,723 | 2,575 | 1,760 | 2,286 | 1,415 | 401 | 1,903 | 3,182 |
| 2024 | 2,087 | |||||||||||
| - = No Data Reported; -- = Not Applicable; NA = Not Available; W = Withheld to avoid disclosure of individual company data. |
| Release Date: 3/29/2024 |
| Next Release Date: 4/30/2024 |