|
Download Data (XLS File) |
|
||||||||
|
||||||||
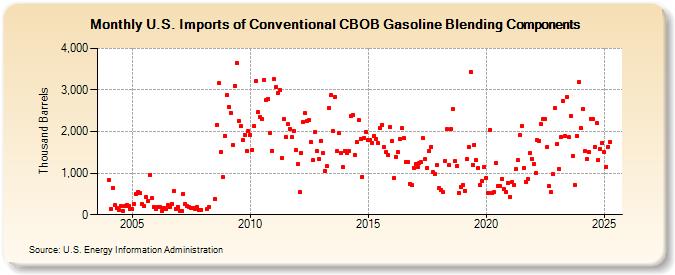
| U.S. Imports of Conventional CBOB Gasoline Blending Components (Thousand Barrels) | ||||||||
| Year | Jan | Feb | Mar | Apr | May | Jun | Jul | Aug | Sep | Oct | Nov | Dec |
|---|---|---|---|---|---|---|---|---|---|---|---|---|
| 2004 | 827 | 147 | 649 | 225 | 150 | 105 | 214 | 100 | 200 | 235 | 200 | 135 |
| 2005 | 135 | 262 | 494 | 550 | 520 | 256 | 205 | 424 | 338 | 963 | 391 | 195 |
| 2006 | 135 | 180 | 175 | 79 | 167 | 140 | 225 | 175 | 264 | 571 | 145 | 196 |
| 2007 | 100 | 100 | 499 | 250 | 199 | 175 | 163 | 171 | 136 | 185 | 125 | 125 |
| 2008 | 135 | 187 | 378 | 2,162 | 3,162 | 1,508 | 899 | 1,905 | ||||
| 2009 | 2,876 | 2,594 | 2,455 | 1,682 | 3,104 | 3,657 | 2,261 | 2,136 | 1,793 | 1,920 | 1,530 | 2,025 |
| 2010 | 1,925 | 1,567 | 2,130 | 3,220 | 2,459 | 2,343 | 2,297 | 3,250 | 2,755 | 2,790 | 1,968 | 1,541 |
| 2011 | 3,253 | 3,066 | 2,932 | 2,998 | 1,370 | 2,290 | 1,866 | 2,171 | 2,070 | 1,871 | 2,009 | 1,549 |
| 2012 | 1,212 | 538 | 1,490 | 2,234 | 2,435 | 2,263 | 2,277 | 1,745 | 1,308 | 1,988 | 1,523 | 1,340 |
| 2013 | 1,780 | 1,488 | 1,054 | 1,162 | 2,561 | 2,877 | 2,025 | 2,842 | 1,524 | 1,954 | 1,481 | 1,137 |
| 2014 | 1,539 | 1,494 | 1,537 | 2,363 | 2,409 | 1,448 | 1,747 | 2,267 | 1,829 | 914 | 1,848 | 1,985 |
| 2015 | 1,790 | 1,801 | 1,725 | 1,888 | 1,823 | 1,715 | 2,085 | 2,164 | 1,620 | 1,506 | 1,425 | 2,109 |
| 2016 | 1,774 | 885 | 1,398 | 1,507 | 1,812 | 2,084 | 1,847 | 1,271 | 1,264 | 749 | 710 | 1,126 |
| 2017 | 1,208 | 1,158 | 1,251 | 1,257 | 1,835 | 1,335 | 1,135 | 1,528 | 1,630 | 1,019 | 979 | 1,192 |
| 2018 | 647 | 599 | 535 | 1,297 | 2,052 | 1,192 | 2,053 | 2,533 | 1,284 | 1,168 | 529 | 675 |
| 2019 | 726 | 577 | 1,329 | 1,631 | 3,443 | 1,206 | 1,686 | 1,310 | 1,118 | 704 | 807 | 1,154 |
| 2020 | 891 | 525 | 2,037 | 514 | 550 | 1,237 | 687 | 682 | 867 | 607 | 543 | 767 |
| 2021 | 426 | 792 | 725 | 1,093 | 1,307 | 1,915 | 2,145 | 1,126 | 794 | 857 | 1,483 | 1,350 |
| 2022 | 1,222 | 996 | 1,796 | 1,782 | 2,173 | 2,292 | 2,302 | 1,634 | 689 | 545 | 984 | 2,558 |
| 2023 | 1,704 | 1,101 | 1,868 | 2,743 | 1,889 | 2,825 | 1,862 | 2,368 | 1,415 | 715 | 1,903 | 3,182 |
| 2024 | 2,087 | 2,534 | 1,532 | 1,343 | 1,509 | 2,313 | ||||||
| - = No Data Reported; -- = Not Applicable; NA = Not Available; W = Withheld to avoid disclosure of individual company data. |
| Release Date: 8/30/2024 |
| Next Release Date: 9/30/2024 |