|
Download Data (XLS File) |
|
||||||||
|
||||||||
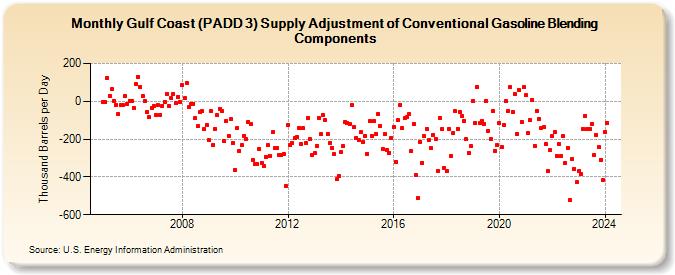
| Gulf Coast (PADD 3) Supply Adjustment of Conventional Gasoline Blending Components (Thousand Barrels per Day) | ||||||||
| Year | Jan | Feb | Mar | Apr | May | Jun | Jul | Aug | Sep | Oct | Nov | Dec |
|---|---|---|---|---|---|---|---|---|---|---|---|---|
| 2005 | -4 | -5 | 123 | 30 | 63 | 3 | -19 | -67 | -19 | -22 | 28 | -14 |
| 2006 | 4 | 0 | -33 | 89 | 130 | 76 | 29 | 2 | -58 | -85 | -35 | -23 |
| 2007 | -71 | -20 | -71 | -23 | -2 | 39 | -23 | 16 | 38 | -11 | 23 | -4 |
| 2008 | 84 | 16 | 99 | -32 | -16 | -12 | -90 | -132 | -57 | -54 | -147 | -125 |
| 2009 | -205 | -54 | -231 | -145 | -74 | -41 | -52 | -210 | -102 | -182 | -95 | -220 |
| 2010 | -363 | -141 | -261 | -232 | -181 | -199 | -108 | -119 | -309 | -332 | -334 | -250 |
| 2011 | -325 | -344 | -293 | -232 | -289 | -165 | -248 | -249 | -282 | -285 | -277 | -446 |
| 2012 | -128 | -233 | -220 | -195 | -189 | -139 | -228 | -143 | -221 | -88 | -201 | -284 |
| 2013 | -276 | -234 | -87 | -175 | -72 | -100 | -173 | -219 | -246 | -281 | -413 | -397 |
| 2014 | -269 | -237 | -109 | -115 | -121 | -17 | -137 | -194 | -205 | -164 | -217 | -182 |
| 2015 | -277 | -105 | -181 | -106 | -171 | -65 | -131 | -253 | -174 | -259 | -271 | -193 |
| 2016 | -136 | -319 | -99 | -17 | -142 | -91 | -84 | -67 | -265 | -119 | -392 | -511 |
| 2017 | -214 | -325 | -185 | -145 | -205 | -249 | -176 | -199 | -367 | -86 | -149 | -352 |
| 2018 | -371 | -144 | -290 | -166 | -53 | -144 | -55 | -77 | -102 | -202 | -271 | -237 |
| 2019 | 1 | -114 | 76 | -116 | -104 | -119 | 3 | -157 | -201 | -53 | -261 | -232 |
| 2020 | -115 | -244 | -126 | -1 | -49 | 73 | -56 | 39 | -174 | 59 | -107 | 74 |
| 2021 | 31 | -166 | -98 | 7 | -236 | -49 | -93 | -143 | -138 | -225 | -369 | -260 |
| 2022 | -184 | -164 | -287 | -225 | -290 | -186 | -326 | -245 | -521 | -304 | -357 | -427 |
| 2023 | -370 | -387 | -144 | -77 | -149 | -149 | -119 | -284 | -178 | -242 | -309 | -417 |
| 2024 | -163 | |||||||||||
| - = No Data Reported; -- = Not Applicable; NA = Not Available; W = Withheld to avoid disclosure of individual company data. |
| Release Date: 3/29/2024 |
| Next Release Date: 4/30/2024 |