|
Download Data (XLS File) |
|
||||||||
|
||||||||
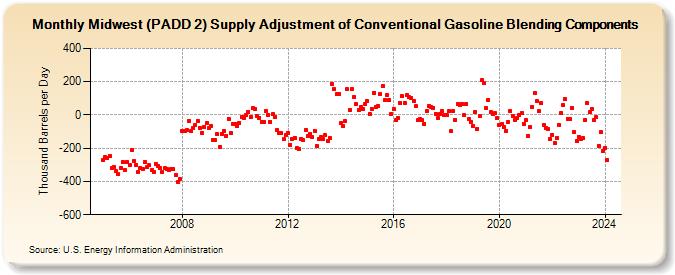
| Midwest (PADD 2) Supply Adjustment of Conventional Gasoline Blending Components (Thousand Barrels per Day) | ||||||||
| Year | Jan | Feb | Mar | Apr | May | Jun | Jul | Aug | Sep | Oct | Nov | Dec |
|---|---|---|---|---|---|---|---|---|---|---|---|---|
| 2005 | -271 | -254 | -260 | -247 | -317 | -311 | -340 | -358 | -318 | -283 | -333 | -282 |
| 2006 | -299 | -209 | -278 | -301 | -342 | -319 | -326 | -285 | -314 | -303 | -334 | -344 |
| 2007 | -294 | -306 | -320 | -343 | -321 | -326 | -331 | -325 | -328 | -364 | -401 | -384 |
| 2008 | -97 | -95 | -93 | -35 | -99 | -80 | -63 | -36 | -76 | -107 | -73 | -49 |
| 2009 | -81 | -66 | -150 | -153 | -116 | -191 | -112 | -95 | -125 | -22 | -109 | -56 |
| 2010 | -54 | -69 | -50 | -10 | -16 | -3 | 18 | -15 | 39 | 33 | -7 | -17 |
| 2011 | -41 | -40 | 23 | 0 | -40 | 4 | -14 | -91 | -106 | -111 | -147 | -120 |
| 2012 | -107 | -178 | -145 | -136 | -201 | -205 | -143 | -153 | -90 | -125 | -116 | -135 |
| 2013 | -95 | -184 | -142 | -134 | -145 | -123 | -158 | -138 | 187 | 153 | 124 | 128 |
| 2014 | -49 | -66 | -39 | 155 | 30 | 156 | 109 | 63 | 31 | 47 | 34 | 64 |
| 2015 | 82 | 6 | 37 | 134 | 47 | 54 | 124 | 175 | 88 | 118 | 87 | 7 |
| 2016 | 37 | -31 | -20 | 74 | 111 | 74 | 118 | 106 | 102 | 86 | 52 | -33 |
| 2017 | -25 | -31 | -53 | 22 | 54 | 48 | 44 | 7 | -19 | 6 | 21 | -2 |
| 2018 | -2 | 22 | -98 | 21 | -29 | 68 | 61 | 66 | -3 | 68 | -25 | -40 |
| 2019 | -65 | 18 | -83 | -8 | 207 | 189 | 40 | 91 | 17 | 6 | 9 | -18 |
| 2020 | -63 | -55 | -75 | -96 | -43 | 21 | -4 | -30 | -17 | 0 | 13 | -56 |
| 2021 | -33 | -125 | -72 | 50 | 129 | 83 | 21 | 69 | -60 | -80 | -83 | -146 |
| 2022 | -118 | -171 | -138 | -60 | 9 | 59 | 93 | -23 | -26 | 43 | -105 | -157 |
| 2023 | -131 | -145 | -139 | -33 | 70 | 16 | 34 | -31 | -15 | -184 | -105 | -217 |
| 2024 | -197 | |||||||||||
| - = No Data Reported; -- = Not Applicable; NA = Not Available; W = Withheld to avoid disclosure of individual company data. |
| Release Date: 3/29/2024 |
| Next Release Date: 4/30/2024 |