|
Download Data (XLS File) |
|
||||||||
|
||||||||
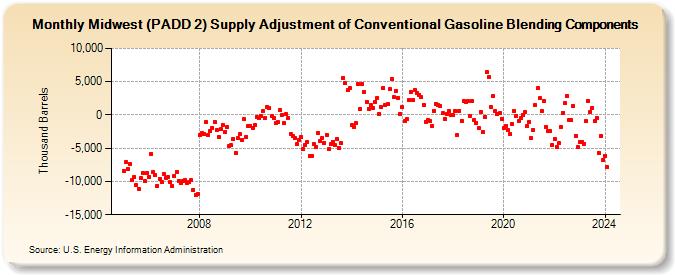
| Midwest (PADD 2) Supply Adjustment of Conventional Gasoline Blending Components (Thousand Barrels) | ||||||||
| Year | Jan | Feb | Mar | Apr | May | Jun | Jul | Aug | Sep | Oct | Nov | Dec |
|---|---|---|---|---|---|---|---|---|---|---|---|---|
| 2005 | -8,408 | -7,112 | -8,055 | -7,405 | -9,821 | -9,331 | -10,543 | -11,093 | -9,536 | -8,775 | -9,978 | -8,744 |
| 2006 | -9,279 | -5,841 | -8,607 | -9,023 | -10,611 | -9,573 | -10,094 | -8,828 | -9,431 | -9,399 | -10,013 | -10,678 |
| 2007 | -9,122 | -8,580 | -9,932 | -10,288 | -9,950 | -9,779 | -10,255 | -10,083 | -9,830 | -11,272 | -12,033 | -11,906 |
| 2008 | -3,013 | -2,760 | -2,882 | -1,041 | -3,073 | -2,402 | -1,942 | -1,102 | -2,279 | -3,318 | -2,182 | -1,508 |
| 2009 | -2,507 | -1,845 | -4,664 | -4,581 | -3,593 | -5,715 | -3,487 | -2,931 | -3,746 | -672 | -3,267 | -1,735 |
| 2010 | -1,660 | -1,944 | -1,549 | -299 | -488 | -88 | 556 | -473 | 1,171 | 1,018 | -212 | -520 |
| 2011 | -1,269 | -1,132 | 719 | 14 | -1,228 | 125 | -429 | -2,817 | -3,194 | -3,444 | -4,414 | -3,735 |
| 2012 | -3,302 | -5,172 | -4,494 | -4,071 | -6,233 | -6,142 | -4,424 | -4,752 | -2,686 | -3,884 | -3,467 | -4,191 |
| 2013 | -2,956 | -5,152 | -4,413 | -4,022 | -4,503 | -3,692 | -4,902 | -4,266 | 5,618 | 4,758 | 3,733 | 3,978 |
| 2014 | -1,525 | -1,852 | -1,196 | 4,662 | 923 | 4,681 | 3,391 | 1,963 | 935 | 1,442 | 1,008 | 1,991 |
| 2015 | 2,543 | 159 | 1,151 | 4,019 | 1,457 | 1,627 | 3,859 | 5,414 | 2,628 | 3,654 | 2,615 | 207 |
| 2016 | 1,142 | -897 | -628 | 2,228 | 3,428 | 2,206 | 3,671 | 3,275 | 3,058 | 2,671 | 1,554 | -1,019 |
| 2017 | -783 | -881 | -1,640 | 662 | 1,662 | 1,443 | 1,358 | 230 | -567 | 179 | 634 | -69 |
| 2018 | -72 | 615 | -3,037 | 630 | -884 | 2,034 | 1,894 | 2,035 | -92 | 2,103 | -742 | -1,250 |
| 2019 | -2,016 | 512 | -2,567 | -240 | 6,406 | 5,661 | 1,235 | 2,829 | 516 | 181 | 262 | -553 |
| 2020 | -1,941 | -1,599 | -2,313 | -2,880 | -1,333 | 642 | -135 | -932 | -510 | 11 | 400 | -1,733 |
| 2021 | -1,037 | -3,488 | -2,244 | 1,489 | 3,997 | 2,491 | 658 | 2,137 | -1,813 | -2,489 | -2,484 | -4,517 |
| 2022 | -3,655 | -4,775 | -4,293 | -1,793 | 265 | 1,762 | 2,897 | -714 | -788 | 1,328 | -3,138 | -4,876 |
| 2023 | -4,059 | -4,056 | -4,308 | -983 | 2,160 | 478 | 1,049 | -953 | -444 | -5,713 | -3,140 | -6,742 |
| 2024 | -6,105 | |||||||||||
| - = No Data Reported; -- = Not Applicable; NA = Not Available; W = Withheld to avoid disclosure of individual company data. |
| Release Date: 3/29/2024 |
| Next Release Date: 4/30/2024 |