|
Download Data (XLS File) |
|
||||||||
|
||||||||
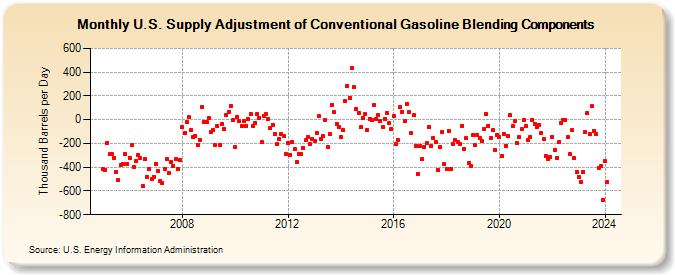
| U.S. Supply Adjustment of Conventional Gasoline Blending Components (Thousand Barrels per Day) | ||||||||
| Year | Jan | Feb | Mar | Apr | May | Jun | Jul | Aug | Sep | Oct | Nov | Dec |
|---|---|---|---|---|---|---|---|---|---|---|---|---|
| 2005 | -411 | -423 | -193 | -290 | -289 | -319 | -441 | -512 | -378 | -372 | -290 | -371 |
| 2006 | -319 | -212 | -400 | -345 | -296 | -322 | -556 | -330 | -481 | -419 | -502 | -479 |
| 2007 | -372 | -431 | -518 | -532 | -416 | -331 | -449 | -355 | -389 | -330 | -414 | -343 |
| 2008 | -64 | -112 | -21 | 20 | -88 | -150 | -136 | -211 | -170 | 110 | -20 | -23 |
| 2009 | 16 | -104 | -91 | -213 | -54 | -209 | -34 | -81 | 40 | 66 | 117 | -5 |
| 2010 | -230 | 26 | -15 | -55 | -12 | -50 | 3 | 47 | -54 | -24 | 45 | 15 |
| 2011 | -192 | 32 | 44 | 8 | -69 | -42 | -117 | -207 | -166 | -123 | -140 | -292 |
| 2012 | -196 | -294 | -186 | -248 | -358 | -289 | -287 | -238 | -174 | -146 | -206 | -161 |
| 2013 | -183 | -115 | 28 | -159 | -140 | -1 | -229 | -121 | 127 | 61 | -34 | -61 |
| 2014 | -144 | -89 | 155 | 287 | 185 | 437 | 273 | 94 | 57 | -64 | 10 | 47 |
| 2015 | -86 | 8 | -5 | 123 | 7 | 39 | -13 | -63 | 7 | 59 | -31 | -75 |
| 2016 | 28 | -205 | -169 | 106 | 67 | -9 | 136 | 63 | -111 | 37 | -219 | -454 |
| 2017 | -220 | -328 | -231 | -199 | -58 | -222 | -153 | -190 | -426 | -233 | -101 | -375 |
| 2018 | -414 | -97 | -411 | -207 | -173 | -185 | -206 | -50 | -247 | -156 | -363 | -391 |
| 2019 | -130 | -212 | -128 | -152 | -182 | -79 | 46 | -51 | -153 | -90 | -253 | -133 |
| 2020 | -145 | -302 | -119 | -218 | -138 | 37 | -57 | -15 | -193 | -149 | -82 | -4 |
| 2021 | -54 | -175 | -147 | 0 | -35 | -58 | -43 | -113 | -162 | -304 | -328 | -317 |
| 2022 | -143 | -254 | -320 | -186 | -32 | -4 | -6 | -147 | -293 | -84 | -326 | -439 |
| 2023 | -480 | -521 | -437 | -106 | 57 | -119 | 116 | -92 | -117 | -406 | -389 | -673 |
| 2024 | -350 | |||||||||||
| - = No Data Reported; -- = Not Applicable; NA = Not Available; W = Withheld to avoid disclosure of individual company data. |
| Release Date: 3/29/2024 |
| Next Release Date: 4/30/2024 |