|
Download Data (XLS File) |
|
||||||||
|
||||||||
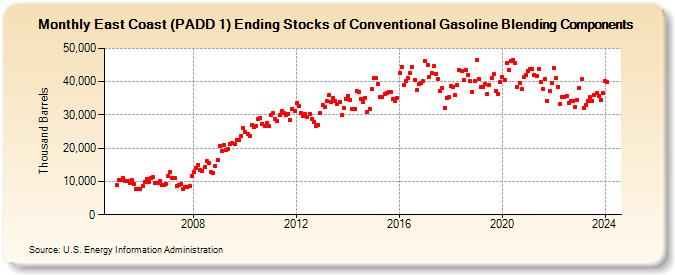
| East Coast (PADD 1) Ending Stocks of Conventional Gasoline Blending Components (Thousand Barrels) | ||||||||
| Year | Jan | Feb | Mar | Apr | May | Jun | Jul | Aug | Sep | Oct | Nov | Dec |
|---|---|---|---|---|---|---|---|---|---|---|---|---|
| 2005 | 8,990 | 10,461 | 10,509 | 10,983 | 10,046 | 10,182 | 9,580 | 10,359 | 9,365 | 7,877 | 7,789 | 7,766 |
| 2006 | 8,563 | 9,760 | 10,880 | 9,881 | 11,165 | 11,481 | 9,620 | 9,615 | 10,110 | 8,839 | 8,783 | 9,300 |
| 2007 | 11,691 | 12,693 | 11,138 | 10,913 | 8,585 | 9,032 | 9,267 | 7,818 | 8,395 | 8,190 | 8,512 | 11,735 |
| 2008 | 12,703 | 14,175 | 14,801 | 13,548 | 13,155 | 14,350 | 16,208 | 15,515 | 12,925 | 12,494 | 14,626 | 16,398 |
| 2009 | 20,614 | 19,304 | 21,077 | 19,318 | 19,690 | 21,287 | 21,418 | 21,343 | 22,577 | 22,470 | 23,739 | 25,925 |
| 2010 | 24,855 | 24,133 | 23,657 | 26,918 | 26,409 | 26,564 | 28,841 | 29,164 | 27,366 | 26,775 | 27,656 | 26,657 |
| 2011 | 29,877 | 30,456 | 28,876 | 28,137 | 30,033 | 31,247 | 30,461 | 30,111 | 30,394 | 28,399 | 31,885 | 31,270 |
| 2012 | 33,653 | 32,815 | 30,531 | 29,574 | 30,282 | 29,493 | 30,353 | 28,859 | 27,945 | 26,608 | 27,031 | 30,638 |
| 2013 | 32,992 | 32,308 | 34,176 | 35,928 | 33,962 | 35,112 | 34,167 | 33,182 | 33,990 | 29,968 | 32,189 | 34,885 |
| 2014 | 35,798 | 34,433 | 31,768 | 31,867 | 37,045 | 36,804 | 34,835 | 33,760 | 35,192 | 30,749 | 31,924 | 37,683 |
| 2015 | 41,178 | 41,166 | 39,309 | 35,478 | 35,491 | 36,336 | 36,711 | 36,922 | 36,938 | 34,781 | 34,156 | 35,127 |
| 2016 | 42,576 | 44,553 | 38,928 | 40,242 | 40,962 | 42,671 | 44,310 | 40,368 | 37,410 | 39,203 | 39,641 | 40,264 |
| 2017 | 46,239 | 45,056 | 41,499 | 42,531 | 44,580 | 42,332 | 40,836 | 37,298 | 38,141 | 32,203 | 35,231 | 35,274 |
| 2018 | 38,625 | 38,337 | 35,977 | 39,085 | 43,563 | 43,239 | 40,591 | 43,468 | 42,124 | 40,127 | 36,980 | 40,182 |
| 2019 | 46,570 | 40,927 | 38,394 | 38,527 | 39,243 | 36,413 | 38,969 | 41,190 | 42,194 | 37,142 | 36,241 | 39,819 |
| 2020 | 41,374 | 40,441 | 45,578 | 43,580 | 46,091 | 46,603 | 45,629 | 38,466 | 39,596 | 37,748 | 41,312 | 41,991 |
| 2021 | 43,297 | 43,695 | 43,781 | 41,871 | 41,761 | 43,842 | 39,789 | 37,670 | 40,923 | 34,074 | 37,050 | 39,531 |
| 2022 | 43,979 | 41,112 | 38,530 | 33,245 | 35,518 | 35,383 | 35,648 | 33,499 | 34,193 | 34,261 | 32,506 | 34,407 |
| 2023 | 38,144 | 40,680 | 32,162 | 32,894 | 34,136 | 35,289 | 34,264 | 36,004 | 36,441 | 35,669 | 34,337 | 36,693 |
| 2024 | 40,307 | 39,758 | ||||||||||
| - = No Data Reported; -- = Not Applicable; NA = Not Available; W = Withheld to avoid disclosure of individual company data. |
| Release Date: 4/30/2024 |
| Next Release Date: 5/31/2024 |