|
Download Data (XLS File) |
|
||||||||
|
||||||||
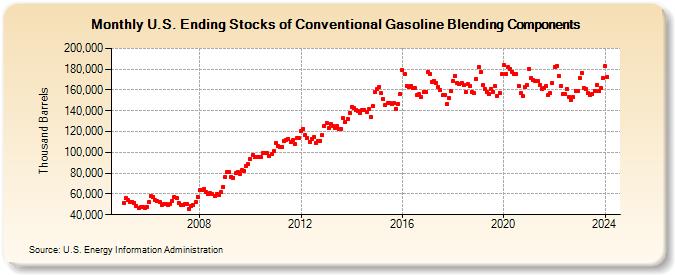
| U.S. Ending Stocks of Conventional Gasoline Blending Components (Thousand Barrels) | ||||||||
| Year | Jan | Feb | Mar | Apr | May | Jun | Jul | Aug | Sep | Oct | Nov | Dec |
|---|---|---|---|---|---|---|---|---|---|---|---|---|
| 2005 | 51,390 | 56,137 | 54,573 | 51,921 | 52,518 | 51,591 | 48,630 | 46,740 | 46,967 | 47,624 | 46,853 | 47,627 |
| 2006 | 52,113 | 57,804 | 57,237 | 53,774 | 52,859 | 52,287 | 49,614 | 50,292 | 50,455 | 49,379 | 49,829 | 53,541 |
| 2007 | 56,898 | 55,665 | 51,707 | 49,487 | 49,264 | 49,929 | 50,211 | 45,959 | 48,003 | 49,529 | 51,933 | 57,293 |
| 2008 | 63,465 | 63,776 | 64,942 | 61,868 | 60,336 | 60,492 | 59,804 | 58,116 | 59,976 | 58,674 | 61,735 | 66,934 |
| 2009 | 75,839 | 81,073 | 80,925 | 76,313 | 75,430 | 79,719 | 81,168 | 79,377 | 82,931 | 82,039 | 87,017 | 88,573 |
| 2010 | 93,216 | 97,430 | 95,706 | 95,405 | 95,048 | 95,197 | 99,153 | 98,975 | 98,921 | 96,525 | 98,294 | 100,887 |
| 2011 | 109,031 | 106,285 | 105,614 | 104,799 | 110,865 | 111,614 | 112,685 | 110,193 | 111,532 | 107,703 | 113,494 | 113,754 |
| 2012 | 120,449 | 122,630 | 116,359 | 113,780 | 110,245 | 113,041 | 114,463 | 108,805 | 110,651 | 110,972 | 116,568 | 125,225 |
| 2013 | 128,216 | 122,965 | 127,334 | 125,476 | 123,732 | 125,047 | 122,748 | 122,727 | 132,642 | 129,029 | 131,921 | 137,842 |
| 2014 | 143,887 | 142,582 | 140,904 | 139,908 | 137,795 | 141,045 | 140,772 | 139,228 | 141,322 | 134,362 | 144,381 | 157,800 |
| 2015 | 160,963 | 162,632 | 157,008 | 151,127 | 145,915 | 147,183 | 147,120 | 146,525 | 147,169 | 142,158 | 146,965 | 156,008 |
| 2016 | 178,772 | 175,261 | 164,196 | 162,996 | 164,102 | 162,008 | 161,518 | 155,395 | 156,040 | 153,714 | 157,786 | 158,056 |
| 2017 | 177,114 | 175,138 | 167,677 | 168,995 | 167,045 | 162,835 | 159,843 | 154,874 | 155,306 | 146,322 | 152,420 | 158,846 |
| 2018 | 168,775 | 173,705 | 166,811 | 165,524 | 167,068 | 164,380 | 158,066 | 165,650 | 163,772 | 158,299 | 156,606 | 170,630 |
| 2019 | 182,079 | 177,477 | 164,312 | 161,297 | 158,222 | 156,327 | 161,025 | 158,390 | 163,545 | 154,184 | 157,554 | 175,005 |
| 2020 | 183,628 | 175,774 | 181,979 | 180,583 | 177,594 | 175,534 | 175,527 | 164,196 | 156,759 | 153,835 | 162,645 | 164,553 |
| 2021 | 180,624 | 171,292 | 169,433 | 169,087 | 168,405 | 164,590 | 160,848 | 161,671 | 163,425 | 154,834 | 157,179 | 167,006 |
| 2022 | 182,539 | 183,167 | 173,636 | 163,711 | 155,690 | 155,931 | 160,894 | 153,497 | 150,247 | 152,969 | 159,359 | 159,400 |
| 2023 | 171,544 | 176,630 | 161,658 | 161,087 | 157,072 | 155,499 | 156,019 | 159,484 | 164,640 | 158,663 | 161,656 | 171,882 |
| 2024 | 182,690 | |||||||||||
| - = No Data Reported; -- = Not Applicable; NA = Not Available; W = Withheld to avoid disclosure of individual company data. |
| Release Date: 3/29/2024 |
| Next Release Date: 4/30/2024 |