|
Download Data (XLS File) |
|
||||||||
|
||||||||
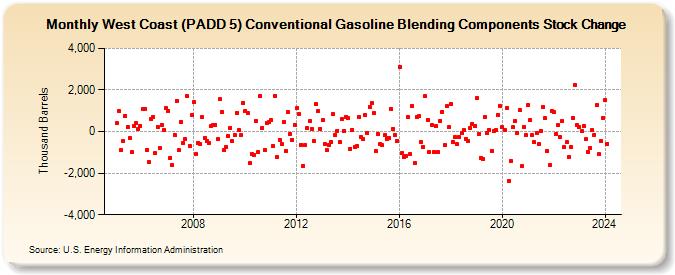
| West Coast (PADD 5) Conventional Gasoline Blending Components Stock Change (Thousand Barrels) | ||||||||
| Year | Jan | Feb | Mar | Apr | May | Jun | Jul | Aug | Sep | Oct | Nov | Dec |
|---|---|---|---|---|---|---|---|---|---|---|---|---|
| 2005 | 396 | 973 | -896 | -462 | 768 | 220 | -309 | -1,006 | 281 | 423 | 127 | 289 |
| 2006 | 1,068 | 1,098 | -879 | -1,478 | 598 | 708 | -1,048 | 219 | -787 | 322 | 98 | 1,115 |
| 2007 | 1,006 | -1,262 | -1,621 | -178 | 1,491 | -878 | 461 | -541 | -376 | 1,686 | -682 | 782 |
| 2008 | 1,398 | -1,100 | -546 | -619 | 681 | -321 | -446 | -563 | 270 | 313 | 325 | -366 |
| 2009 | 1,543 | 951 | -908 | -739 | -213 | 188 | -465 | -188 | 913 | 71 | -158 | 1,388 |
| 2010 | 994 | 893 | -1,513 | -1,079 | -1,134 | 525 | -976 | 1,703 | 173 | -886 | 410 | 437 |
| 2011 | 545 | -700 | 1,724 | -1,233 | -389 | -577 | 467 | -955 | 929 | -121 | -386 | 317 |
| 2012 | 1,119 | 834 | -645 | -1,641 | -651 | 159 | 494 | 132 | -457 | 1,322 | 974 | 144 |
| 2013 | 550 | -581 | -882 | -644 | -505 | 824 | -155 | 41 | -479 | 591 | 31 | 714 |
| 2014 | 652 | -819 | 94 | -726 | -714 | 694 | -258 | -382 | 793 | -50 | 1,197 | 1,359 |
| 2015 | 870 | -952 | -112 | -587 | -652 | -173 | -341 | -294 | 1,088 | 135 | -152 | -437 |
| 2016 | 3,099 | -1,034 | -1,211 | -1,152 | 687 | -1,095 | 1,238 | -1,533 | 697 | 729 | -515 | -722 |
| 2017 | 1,697 | 569 | -993 | 296 | -1,005 | 263 | -982 | 531 | 958 | -657 | 1,216 | 214 |
| 2018 | 1,328 | -518 | -276 | -616 | -274 | -77 | 58 | -337 | -459 | 168 | 373 | 262 |
| 2019 | 1,600 | -115 | -1,252 | -1,325 | 694 | -65 | 79 | -935 | 21 | 54 | 817 | 1,219 |
| 2020 | 197 | 98 | 1,121 | -2,369 | -1,409 | 198 | 513 | -77 | 1,016 | -1,672 | 213 | -166 |
| 2021 | 1,262 | 548 | -180 | -525 | -73 | -618 | 45 | 1,202 | 631 | -931 | -1,614 | 1,000 |
| 2022 | 919 | -110 | 292 | -271 | 509 | -750 | -505 | -1,240 | -739 | 649 | 2,218 | 302 |
| 2023 | 226 | 8 | 245 | -377 | -962 | -790 | 77 | -145 | 1,254 | -1,100 | -454 | 667 |
| 2024 | 1,512 | -586 | ||||||||||
| - = No Data Reported; -- = Not Applicable; NA = Not Available; W = Withheld to avoid disclosure of individual company data. |
| Release Date: 4/30/2024 |
| Next Release Date: 5/31/2024 |