|
Download Data (XLS File) |
|
||||||||
|
||||||||
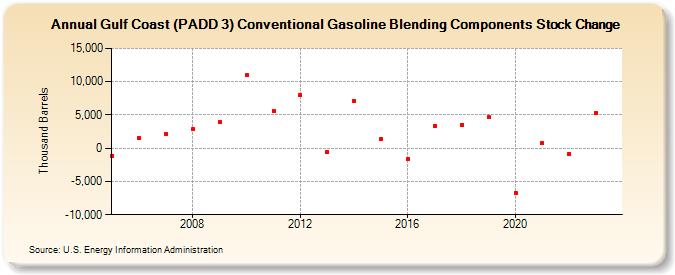
| Gulf Coast (PADD 3) Conventional Gasoline Blending Components Stock Change (Thousand Barrels) | ||||||||
| Decade | Year-0 | Year-1 | Year-2 | Year-3 | Year-4 | Year-5 | Year-6 | Year-7 | Year-8 | Year-9 |
|---|---|---|---|---|---|---|---|---|---|---|
| 2000's | -1,105 | 1,560 | 2,192 | 2,861 | 3,958 | |||||
| 2010's | 10,979 | 5,629 | 8,013 | -539 | 7,098 | 1,446 | -1,675 | 3,306 | 3,553 | 4,613 |
| 2020's | -6,682 | 757 | -821 | 5,334 |
| - = No Data Reported; -- = Not Applicable; NA = Not Available; W = Withheld to avoid disclosure of individual company data. |
| Release Date: 3/29/2024 |
| Next Release Date: 8/30/2024 |