|
Download Data (XLS File) |
|
||||||||
|
||||||||
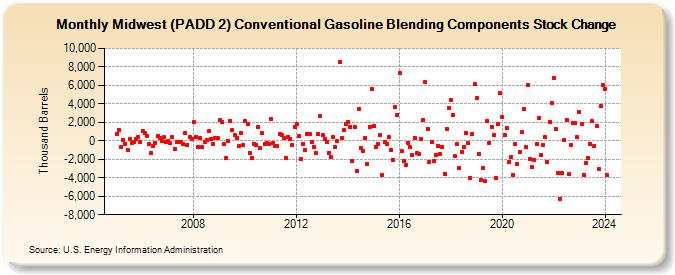
| Midwest (PADD 2) Conventional Gasoline Blending Components Stock Change (Thousand Barrels) | ||||||||
| Year | Jan | Feb | Mar | Apr | May | Jun | Jul | Aug | Sep | Oct | Nov | Dec |
|---|---|---|---|---|---|---|---|---|---|---|---|---|
| 2005 | 778 | 1,155 | -639 | 133 | -301 | -946 | 164 | -285 | -125 | 203 | 364 | -148 |
| 2006 | 1,077 | 877 | 478 | -379 | -1,273 | -518 | -190 | 488 | 314 | -18 | 373 | -120 |
| 2007 | 10 | -285 | 413 | -902 | -153 | -118 | -111 | -357 | 852 | -420 | 407 | 185 |
| 2008 | 2,082 | 436 | -687 | 325 | -709 | -89 | 92 | 1,008 | 248 | -385 | 251 | 324 |
| 2009 | 2,219 | 2,061 | -369 | -1,826 | -30 | 2,192 | 1,152 | 667 | 259 | -583 | 795 | -406 |
| 2010 | 2,132 | 1,793 | -1,277 | -1,847 | -302 | -508 | 1,533 | -813 | 812 | -367 | -198 | -382 |
| 2011 | 2,345 | -185 | -594 | -582 | 785 | 608 | 297 | -1,879 | 420 | 225 | -426 | 1,531 |
| 2012 | 1,869 | 476 | -1,948 | -295 | -966 | 725 | 740 | -178 | -646 | -1,291 | 747 | 2,643 |
| 2013 | 630 | 144 | -97 | -1,286 | -1,755 | 376 | -700 | -58 | 8,518 | 298 | 1,132 | 1,870 |
| 2014 | 2,083 | 1,496 | -2,209 | 1,543 | -3,237 | 3,486 | -782 | -1,056 | 334 | -2,461 | 1,537 | 5,642 |
| 2015 | 1,555 | -676 | -351 | 668 | -3,734 | -91 | -314 | 358 | -1,006 | -2,044 | 3,657 | 2,834 |
| 2016 | 7,331 | -1,085 | -2,146 | -2,635 | -193 | -706 | -1,488 | 316 | -1,292 | -1,385 | 160 | 2,273 |
| 2017 | 6,312 | 1,328 | -2,290 | -134 | -2,213 | -1,532 | -513 | -1,407 | -656 | -3,616 | 1,319 | 3,544 |
| 2018 | 4,450 | 2,819 | -1,653 | -332 | -2,997 | -1,175 | -669 | 818 | -247 | -3,978 | 751 | 6,127 |
| 2019 | 4,608 | -1,395 | -4,288 | -2,948 | -4,361 | 2,178 | -203 | 1,541 | 582 | -4,029 | 1,770 | 5,194 |
| 2020 | 2,583 | 604 | 1,351 | -2,336 | -1,799 | -3,704 | -373 | -2,492 | -1,233 | 920 | 3,408 | -695 |
| 2021 | 6,003 | -1,985 | -2,875 | -2,071 | -360 | 2,437 | -1,582 | -412 | 357 | -2,332 | 2,042 | 4,141 |
| 2022 | 6,793 | 1,298 | -3,512 | -6,280 | -3,440 | 66 | 2,291 | -3,615 | -417 | 1,873 | 1,916 | 378 |
| 2023 | 3,112 | 1,824 | -3,661 | -2,402 | -1,823 | -343 | 2,104 | -559 | 1,547 | -2,999 | 3,714 | 6,073 |
| 2024 | 5,572 | -3,739 | ||||||||||
| - = No Data Reported; -- = Not Applicable; NA = Not Available; W = Withheld to avoid disclosure of individual company data. |
| Release Date: 4/30/2024 |
| Next Release Date: 5/31/2024 |