|
Download Data (XLS File) |
|
||||||||
|
||||||||
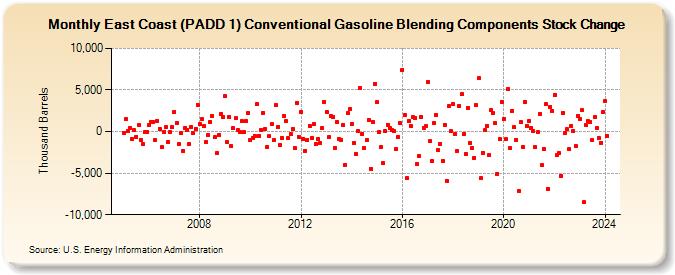
| East Coast (PADD 1) Conventional Gasoline Blending Components Stock Change (Thousand Barrels) | ||||||||
| Year | Jan | Feb | Mar | Apr | May | Jun | Jul | Aug | Sep | Oct | Nov | Dec |
|---|---|---|---|---|---|---|---|---|---|---|---|---|
| 2005 | -143 | 1,471 | 48 | 474 | -937 | 136 | -602 | 779 | -994 | -1,488 | -88 | -23 |
| 2006 | 797 | 1,197 | 1,120 | -999 | 1,284 | 316 | -1,861 | -5 | 495 | -1,271 | -56 | 517 |
| 2007 | 2,391 | 1,002 | -1,555 | -225 | -2,328 | 447 | 235 | -1,449 | 577 | -205 | 322 | 3,223 |
| 2008 | 968 | 1,472 | 626 | -1,253 | -393 | 1,195 | 1,858 | -693 | -2,590 | -431 | 2,132 | 1,772 |
| 2009 | 4,216 | -1,310 | 1,773 | -1,759 | 372 | 1,597 | 131 | -75 | 1,234 | -107 | 1,269 | 2,186 |
| 2010 | -1,070 | -722 | -476 | 3,261 | -509 | 155 | 2,277 | 323 | -1,798 | -591 | 881 | -999 |
| 2011 | 3,220 | 579 | -1,580 | -739 | 1,896 | 1,214 | -786 | -350 | 283 | -1,995 | 3,486 | -615 |
| 2012 | 2,383 | -838 | -2,284 | -957 | 708 | -789 | 860 | -1,494 | -914 | -1,337 | 423 | 3,607 |
| 2013 | 2,354 | -684 | 1,868 | 1,752 | -1,966 | 1,150 | -945 | -985 | 808 | -4,022 | 2,221 | 2,696 |
| 2014 | 913 | -1,365 | -2,665 | 99 | 5,178 | -241 | -1,969 | -1,075 | 1,432 | -4,443 | 1,175 | 5,759 |
| 2015 | 3,495 | -12 | -1,857 | -3,831 | 13 | 845 | 375 | 211 | 16 | -2,157 | -625 | 971 |
| 2016 | 7,449 | 1,977 | -5,625 | 1,314 | 720 | 1,709 | 1,639 | -3,942 | -2,958 | 1,793 | 438 | 623 |
| 2017 | 5,975 | -1,183 | -3,557 | 1,032 | 2,049 | -2,248 | -1,496 | -3,538 | 843 | -5,938 | 3,028 | 43 |
| 2018 | 3,351 | -288 | -2,360 | 3,108 | 4,478 | -324 | -2,648 | 2,877 | -1,344 | -1,997 | -3,147 | 3,202 |
| 2019 | 6,388 | -5,643 | -2,533 | 133 | 716 | -2,830 | 2,556 | 2,221 | 1,004 | -5,052 | -901 | 3,578 |
| 2020 | 1,555 | -933 | 5,137 | -1,998 | 2,511 | 512 | -974 | -7,163 | 1,130 | -1,848 | 3,564 | 679 |
| 2021 | 1,306 | 398 | 86 | -1,910 | -110 | 2,081 | -4,053 | -2,119 | 3,253 | -6,849 | 2,976 | 2,481 |
| 2022 | 4,448 | -2,867 | -2,582 | -5,285 | 2,273 | -135 | 265 | -2,149 | 694 | 68 | -1,755 | 1,901 |
| 2023 | 1,476 | 2,536 | -8,518 | 732 | 1,242 | 1,153 | -1,025 | 1,740 | 437 | -772 | -1,332 | 2,356 |
| 2024 | 3,614 | |||||||||||
| - = No Data Reported; -- = Not Applicable; NA = Not Available; W = Withheld to avoid disclosure of individual company data. |
| Release Date: 3/29/2024 |
| Next Release Date: 4/30/2024 |