|
Download Data (XLS File) |
|
||||||||
|
||||||||
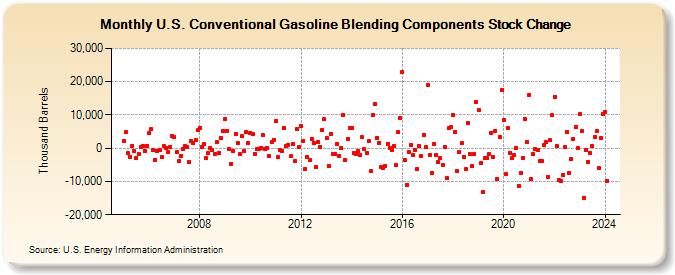
| U.S. Conventional Gasoline Blending Components Stock Change (Thousand Barrels) | ||||||||
| Year | Jan | Feb | Mar | Apr | May | Jun | Jul | Aug | Sep | Oct | Nov | Dec |
|---|---|---|---|---|---|---|---|---|---|---|---|---|
| 2005 | 2,025 | 4,747 | -1,564 | -2,652 | 597 | -927 | -2,961 | -1,890 | 227 | 657 | -771 | 774 |
| 2006 | 4,486 | 5,691 | -567 | -3,463 | -915 | -572 | -2,673 | 678 | 163 | -1,076 | 450 | 3,712 |
| 2007 | 3,357 | -1,233 | -3,958 | -2,220 | -223 | 665 | 282 | -4,252 | 2,044 | 1,526 | 2,404 | 5,360 |
| 2008 | 6,172 | 311 | 1,166 | -3,074 | -1,532 | 156 | -688 | -1,688 | 1,860 | -1,302 | 3,061 | 5,199 |
| 2009 | 8,905 | 5,234 | -148 | -4,612 | -883 | 4,289 | 1,449 | -1,791 | 3,554 | -892 | 4,978 | 1,556 |
| 2010 | 4,643 | 4,214 | -1,724 | -301 | -357 | 149 | 3,956 | -178 | -54 | -2,396 | 1,769 | 2,593 |
| 2011 | 8,144 | -2,746 | -671 | -815 | 6,066 | 749 | 1,071 | -2,492 | 1,339 | -3,829 | 5,791 | 260 |
| 2012 | 6,695 | 2,181 | -6,271 | -2,579 | -3,535 | 2,796 | 1,422 | -5,658 | 1,846 | 321 | 5,596 | 8,657 |
| 2013 | 2,991 | -5,251 | 4,369 | -1,858 | -1,744 | 1,315 | -2,299 | -21 | 9,915 | -3,613 | 2,892 | 5,921 |
| 2014 | 6,045 | -1,305 | -1,678 | -996 | -2,113 | 3,250 | -273 | -1,544 | 2,094 | -6,960 | 10,019 | 13,419 |
| 2015 | 3,163 | 1,669 | -5,624 | -5,881 | -5,212 | 1,268 | -63 | -595 | 644 | -5,011 | 4,807 | 9,043 |
| 2016 | 22,764 | -3,511 | -11,065 | -1,200 | 1,106 | -2,094 | -490 | -6,123 | 645 | -2,326 | 4,072 | 270 |
| 2017 | 19,058 | -1,976 | -7,461 | 1,318 | -1,950 | -4,210 | -2,992 | -4,969 | 432 | -8,984 | 6,098 | 6,426 |
| 2018 | 9,929 | 4,930 | -6,894 | -1,287 | 1,544 | -2,688 | -6,314 | 7,584 | -1,878 | -5,473 | -1,693 | 14,024 |
| 2019 | 11,449 | -4,602 | -13,165 | -3,015 | -3,075 | -1,895 | 4,698 | -2,635 | 5,155 | -9,361 | 3,370 | 17,451 |
| 2020 | 8,623 | -7,854 | 6,205 | -1,396 | -2,989 | -2,060 | -7 | -11,331 | -7,437 | -2,924 | 8,810 | 1,908 |
| 2021 | 16,071 | -9,332 | -1,859 | -346 | -682 | -3,815 | -3,742 | 823 | 1,754 | -8,591 | 2,345 | 9,827 |
| 2022 | 15,533 | 629 | -9,531 | -9,925 | -8,021 | 241 | 4,963 | -7,397 | -3,250 | 2,722 | 6,390 | 41 |
| 2023 | 10,158 | 5,085 | -14,972 | -571 | -4,015 | -1,573 | 520 | 3,465 | 5,156 | -5,977 | 2,993 | 10,226 |
| 2024 | 10,808 | |||||||||||
| - = No Data Reported; -- = Not Applicable; NA = Not Available; W = Withheld to avoid disclosure of individual company data. |
| Release Date: 3/29/2024 |
| Next Release Date: 4/30/2024 |