|
Download Data (XLS File) |
|
||||||||
|
||||||||
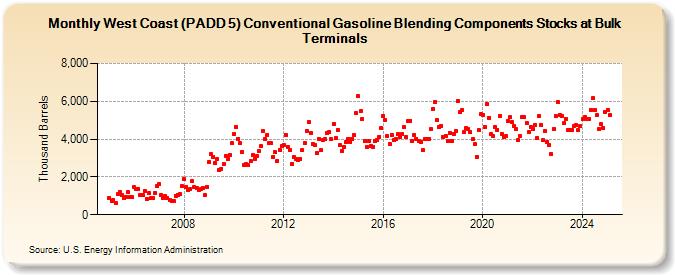
| West Coast (PADD 5) Conventional Gasoline Blending Components Stocks at Bulk Terminals (Thousand Barrels) | ||||||||
| Year | Jan | Feb | Mar | Apr | May | Jun | Jul | Aug | Sep | Oct | Nov | Dec |
|---|---|---|---|---|---|---|---|---|---|---|---|---|
| 2005 | 909 | 751 | 772 | 612 | 1,080 | 1,189 | 1,032 | 876 | 940 | 1,183 | 921 | 914 |
| 2006 | 1,451 | 1,353 | 1,379 | 1,055 | 1,023 | 1,277 | 827 | 1,126 | 858 | 858 | 1,174 | 1,500 |
| 2007 | 1,620 | 1,042 | 876 | 981 | 900 | 763 | 733 | 713 | 1,014 | 1,053 | 1,077 | 1,497 |
| 2008 | 1,871 | 1,462 | 1,300 | 1,334 | 1,768 | 1,464 | 1,395 | 1,325 | 1,336 | 1,418 | 1,040 | 1,485 |
| 2009 | 2,788 | 3,199 | 3,072 | 2,719 | 2,946 | 2,348 | 2,434 | 2,691 | 3,118 | 2,953 | 3,172 | 3,778 |
| 2010 | 4,280 | 4,635 | 4,027 | 3,774 | 3,337 | 2,605 | 2,680 | 2,611 | 2,826 | 3,166 | 2,961 | 3,107 |
| 2011 | 3,360 | 3,617 | 4,406 | 3,999 | 4,235 | 3,787 | 3,776 | 3,073 | 3,296 | 2,856 | 3,444 | 3,631 |
| 2012 | 3,697 | 4,231 | 3,583 | 3,416 | 2,696 | 3,035 | 2,972 | 2,882 | 2,956 | 3,433 | 3,809 | 4,416 |
| 2013 | 4,884 | 4,320 | 3,743 | 3,685 | 3,244 | 4,017 | 3,404 | 3,977 | 3,995 | 4,301 | 4,365 | 3,984 |
| 2014 | 4,811 | 4,063 | 4,489 | 3,671 | 3,378 | 3,560 | 3,824 | 4,007 | 3,849 | 4,019 | 4,215 | 5,374 |
| 2015 | 6,255 | 5,473 | 5,061 | 3,885 | 3,588 | 3,893 | 3,647 | 3,605 | 3,917 | 3,970 | 4,135 | 4,584 |
| 2016 | 5,203 | 5,011 | 4,142 | 3,735 | 4,231 | 3,936 | 3,985 | 4,254 | 4,095 | 4,256 | 4,631 | 4,099 |
| 2017 | 4,944 | 4,976 | 3,883 | 4,206 | 4,016 | 3,908 | 3,844 | 3,408 | 4,029 | 3,994 | 4,023 | 4,524 |
| 2018 | 5,618 | 5,967 | 4,984 | 4,630 | 4,680 | 4,133 | 4,168 | 3,899 | 4,346 | 3,877 | 4,283 | 4,413 |
| 2019 | 6,012 | 5,428 | 5,526 | 4,365 | 4,564 | 4,512 | 4,366 | 3,993 | 3,722 | 3,067 | 4,465 | 5,308 |
| 2020 | 5,299 | 4,660 | 5,838 | 5,136 | 4,267 | 4,160 | 4,628 | 4,502 | 5,204 | 4,279 | 4,113 | 4,149 |
| 2021 | 4,970 | 5,145 | 4,886 | 4,680 | 4,520 | 3,948 | 4,151 | 5,154 | 5,153 | 4,846 | 4,363 | 4,644 |
| 2022 | 4,544 | 4,750 | 4,053 | 5,218 | 4,771 | 3,933 | 4,405 | 3,855 | 3,675 | 3,200 | 4,539 | 5,224 |
| 2023 | 5,965 | 5,278 | 5,233 | 4,832 | 5,073 | 4,575 | 4,533 | 4,525 | 4,678 | 4,721 | 4,470 | 4,686 |
| 2024 | 5,054 | 5,151 | ||||||||||
| - = No Data Reported; -- = Not Applicable; NA = Not Available; W = Withheld to avoid disclosure of individual company data. |
| Release Date: 4/30/2024 |
| Next Release Date: 5/31/2024 |