|
Download Data (XLS File) |
|
||||||||
|
||||||||
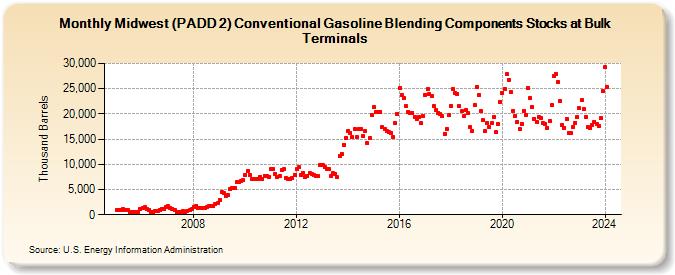
| Midwest (PADD 2) Conventional Gasoline Blending Components Stocks at Bulk Terminals (Thousand Barrels) | ||||||||
| Year | Jan | Feb | Mar | Apr | May | Jun | Jul | Aug | Sep | Oct | Nov | Dec |
|---|---|---|---|---|---|---|---|---|---|---|---|---|
| 2005 | 937 | 938 | 939 | 1,066 | 968 | 999 | 526 | 462 | 528 | 483 | 627 | 1,159 |
| 2006 | 1,324 | 1,451 | 1,152 | 1,003 | 608 | 570 | 670 | 654 | 971 | 1,172 | 1,108 | 1,469 |
| 2007 | 1,675 | 1,365 | 1,221 | 878 | 603 | 538 | 517 | 674 | 620 | 659 | 885 | 1,092 |
| 2008 | 1,585 | 1,806 | 1,314 | 1,347 | 1,380 | 1,275 | 1,471 | 1,698 | 1,666 | 1,661 | 2,117 | 2,263 |
| 2009 | 2,914 | 4,412 | 4,253 | 3,685 | 3,820 | 5,033 | 5,207 | 5,367 | 6,414 | 6,491 | 6,714 | 6,853 |
| 2010 | 7,917 | 8,704 | 7,946 | 7,040 | 7,093 | 6,986 | 7,100 | 7,549 | 7,136 | 7,706 | 7,739 | 7,575 |
| 2011 | 9,054 | 9,035 | 8,108 | 7,537 | 7,732 | 8,898 | 9,011 | 7,283 | 7,131 | 7,086 | 7,275 | 7,951 |
| 2012 | 9,065 | 9,415 | 7,836 | 8,306 | 7,422 | 7,711 | 8,318 | 8,055 | 7,923 | 7,685 | 7,631 | 9,854 |
| 2013 | 9,954 | 9,389 | 9,078 | 9,085 | 7,636 | 8,210 | 8,039 | 7,415 | 11,603 | 12,117 | 13,885 | 15,274 |
| 2014 | 16,609 | 16,227 | 15,351 | 17,018 | 15,384 | 17,031 | 16,977 | 15,677 | 16,518 | 14,128 | 15,148 | 19,752 |
| 2015 | 21,307 | 20,286 | 20,448 | 20,422 | 17,326 | 17,034 | 16,576 | 16,315 | 16,173 | 15,449 | 18,179 | 20,038 |
| 2016 | 25,090 | 23,771 | 23,131 | 21,512 | 20,408 | 20,258 | 20,208 | 19,386 | 18,976 | 19,290 | 18,114 | 19,620 |
| 2017 | 23,816 | 24,890 | 23,914 | 23,567 | 21,533 | 20,761 | 20,263 | 19,902 | 19,498 | 16,082 | 17,083 | 19,711 |
| 2018 | 21,639 | 24,863 | 24,169 | 24,028 | 21,491 | 20,493 | 19,494 | 20,816 | 20,173 | 17,306 | 16,579 | 21,771 |
| 2019 | 25,356 | 23,758 | 20,484 | 18,700 | 16,617 | 18,125 | 17,357 | 18,181 | 19,475 | 16,406 | 18,094 | 22,418 |
| 2020 | 24,228 | 24,951 | 27,854 | 26,814 | 24,299 | 20,623 | 19,584 | 18,449 | 16,959 | 18,015 | 20,647 | 19,856 |
| 2021 | 25,059 | 23,186 | 21,378 | 19,053 | 18,419 | 19,342 | 19,280 | 18,219 | 18,075 | 17,270 | 18,618 | 21,710 |
| 2022 | 27,554 | 27,945 | 26,371 | 22,504 | 17,854 | 17,255 | 19,076 | 16,258 | 16,176 | 17,407 | 18,267 | 19,326 |
| 2023 | 21,082 | 22,731 | 20,874 | 19,421 | 17,346 | 17,144 | 17,841 | 18,406 | 18,021 | 17,563 | 19,172 | 24,561 |
| 2024 | 29,249 | |||||||||||
| - = No Data Reported; -- = Not Applicable; NA = Not Available; W = Withheld to avoid disclosure of individual company data. |
| Release Date: 3/29/2024 |
| Next Release Date: 4/30/2024 |