|
Download Data (XLS File) |
|
||||||||
|
||||||||
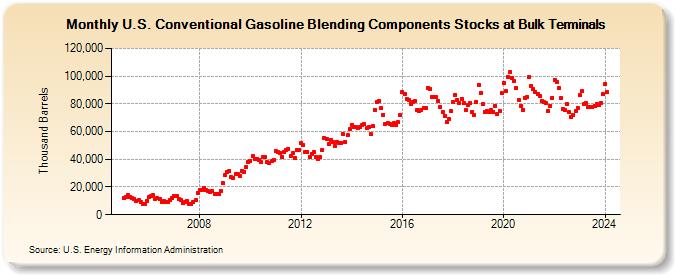
| U.S. Conventional Gasoline Blending Components Stocks at Bulk Terminals (Thousand Barrels) | ||||||||
| Year | Jan | Feb | Mar | Apr | May | Jun | Jul | Aug | Sep | Oct | Nov | Dec |
|---|---|---|---|---|---|---|---|---|---|---|---|---|
| 2005 | 11,798 | 13,098 | 13,917 | 12,981 | 12,025 | 11,662 | 9,870 | 10,406 | 9,070 | 8,000 | 8,001 | 10,239 |
| 2006 | 12,608 | 13,579 | 14,007 | 11,443 | 11,713 | 11,535 | 9,078 | 9,591 | 8,939 | 9,391 | 10,420 | 12,145 |
| 2007 | 13,304 | 13,826 | 11,111 | 10,422 | 8,765 | 9,412 | 9,653 | 7,601 | 7,547 | 8,886 | 10,362 | 15,946 |
| 2008 | 18,104 | 18,067 | 19,298 | 17,846 | 16,877 | 16,457 | 16,978 | 15,041 | 14,947 | 14,675 | 16,954 | 22,555 |
| 2009 | 28,610 | 30,889 | 31,578 | 27,110 | 26,317 | 29,470 | 29,582 | 28,283 | 31,845 | 30,592 | 34,656 | 37,754 |
| 2010 | 38,653 | 42,530 | 40,167 | 40,399 | 39,333 | 37,796 | 41,679 | 41,385 | 37,829 | 37,667 | 38,712 | 39,655 |
| 2011 | 46,024 | 45,188 | 44,664 | 41,924 | 44,916 | 46,989 | 47,414 | 42,375 | 44,356 | 41,007 | 46,946 | 46,999 |
| 2012 | 51,844 | 50,383 | 45,602 | 45,255 | 41,851 | 43,837 | 44,930 | 41,303 | 40,335 | 41,577 | 46,761 | 55,189 |
| 2013 | 54,723 | 50,803 | 53,726 | 52,281 | 49,512 | 52,662 | 51,816 | 52,000 | 57,929 | 52,430 | 57,299 | 61,771 |
| 2014 | 65,058 | 63,626 | 62,956 | 62,419 | 63,609 | 64,594 | 65,096 | 62,513 | 63,110 | 57,901 | 63,717 | 75,846 |
| 2015 | 81,418 | 82,038 | 77,226 | 72,133 | 65,540 | 66,026 | 65,769 | 64,757 | 65,833 | 64,604 | 66,637 | 71,972 |
| 2016 | 88,699 | 87,179 | 83,564 | 82,484 | 79,801 | 81,380 | 81,730 | 75,853 | 74,944 | 75,646 | 77,015 | 77,072 |
| 2017 | 91,520 | 90,851 | 84,982 | 85,264 | 84,765 | 82,008 | 78,040 | 73,930 | 71,528 | 66,803 | 68,951 | 74,534 |
| 2018 | 80,981 | 86,484 | 83,024 | 80,796 | 83,811 | 80,550 | 75,671 | 79,474 | 80,508 | 74,375 | 71,810 | 81,571 |
| 2019 | 93,613 | 87,961 | 79,651 | 74,183 | 74,470 | 74,115 | 75,782 | 74,177 | 78,535 | 72,994 | 74,604 | 87,572 |
| 2020 | 95,077 | 89,228 | 99,676 | 102,922 | 98,504 | 96,258 | 91,526 | 83,093 | 78,556 | 75,765 | 84,436 | 85,013 |
| 2021 | 99,692 | 93,152 | 90,413 | 88,304 | 86,900 | 85,754 | 82,035 | 81,212 | 80,589 | 74,987 | 78,437 | 84,395 |
| 2022 | 97,147 | 95,660 | 91,291 | 84,336 | 76,114 | 75,442 | 80,176 | 73,793 | 70,604 | 71,878 | 74,935 | 77,221 |
| 2023 | 86,069 | 88,983 | 79,602 | 80,320 | 78,007 | 77,512 | 77,746 | 78,575 | 79,770 | 78,828 | 80,867 | 86,829 |
| 2024 | 94,449 | |||||||||||
| - = No Data Reported; -- = Not Applicable; NA = Not Available; W = Withheld to avoid disclosure of individual company data. |
| Release Date: 3/29/2024 |
| Next Release Date: 4/30/2024 |