|
Download Data (XLS File) |
|
||||||||
|
||||||||
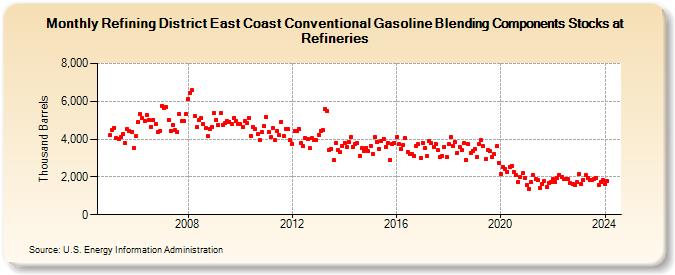
| Refining District East Coast Conventional Gasoline Blending Components Stocks at Refineries (Thousand Barrels) | ||||||||
| Year | Jan | Feb | Mar | Apr | May | Jun | Jul | Aug | Sep | Oct | Nov | Dec |
|---|---|---|---|---|---|---|---|---|---|---|---|---|
| 2005 | 4,191 | 4,501 | 4,613 | 4,049 | 4,004 | 4,104 | 4,280 | 3,817 | 4,520 | 4,422 | 4,380 | 3,550 |
| 2006 | 4,143 | 4,902 | 5,319 | 5,091 | 4,977 | 5,264 | 5,003 | 4,660 | 5,012 | 4,797 | 4,385 | 4,438 |
| 2007 | 5,773 | 5,621 | 5,684 | 5,028 | 4,438 | 4,733 | 4,486 | 4,363 | 5,332 | 4,938 | 4,950 | 5,338 |
| 2008 | 6,097 | 6,464 | 6,581 | 5,232 | 4,630 | 4,992 | 5,097 | 4,810 | 4,568 | 4,161 | 4,530 | 4,638 |
| 2009 | 5,392 | 5,030 | 4,732 | 5,369 | 4,770 | 4,837 | 4,960 | 4,922 | 4,787 | 5,116 | 4,956 | 4,780 |
| 2010 | 4,778 | 4,644 | 4,934 | 4,836 | 5,117 | 4,178 | 4,616 | 4,531 | 4,251 | 3,936 | 4,371 | 4,681 |
| 2011 | 5,159 | 4,390 | 4,097 | 4,594 | 3,934 | 4,437 | 4,198 | 4,919 | 4,178 | 4,548 | 4,515 | 3,926 |
| 2012 | 3,757 | 4,439 | 4,454 | 4,549 | 3,790 | 3,612 | 4,044 | 3,982 | 3,504 | 4,044 | 3,937 | 3,942 |
| 2013 | 4,216 | 4,446 | 4,492 | 5,603 | 5,481 | 3,446 | 3,501 | 2,899 | 3,794 | 3,425 | 3,316 | 3,637 |
| 2014 | 3,811 | 3,589 | 3,849 | 4,098 | 3,599 | 3,748 | 3,768 | 3,107 | 3,540 | 3,389 | 3,543 | 3,345 |
| 2015 | 3,654 | 3,215 | 4,104 | 3,858 | 3,496 | 3,917 | 4,018 | 3,602 | 3,815 | 2,918 | 3,748 | 3,804 |
| 2016 | 4,133 | 3,739 | 3,473 | 3,686 | 4,048 | 3,308 | 3,188 | 3,231 | 3,116 | 3,613 | 3,722 | 2,998 |
| 2017 | 3,794 | 3,503 | 3,092 | 3,913 | 3,769 | 3,608 | 3,757 | 3,423 | 3,066 | 3,092 | 3,578 | 3,042 |
| 2018 | 3,715 | 4,108 | 3,647 | 3,839 | 3,291 | 3,593 | 3,406 | 3,794 | 2,885 | 3,737 | 3,265 | 3,396 |
| 2019 | 3,490 | 3,040 | 3,750 | 3,929 | 3,611 | 2,944 | 3,421 | 3,352 | 3,078 | 3,206 | 3,619 | 2,747 |
| 2020 | 2,176 | 2,517 | 2,442 | 2,264 | 2,533 | 2,582 | 2,281 | 2,113 | 1,742 | 1,975 | 2,182 | 1,918 |
| 2021 | 1,578 | 1,379 | 1,728 | 2,075 | 1,867 | 1,836 | 1,439 | 1,624 | 1,780 | 1,478 | 1,683 | 1,710 |
| 2022 | 1,877 | 1,748 | 1,921 | 2,093 | 1,991 | 1,899 | 1,911 | 1,875 | 1,655 | 1,632 | 1,579 | 1,711 |
| 2023 | 2,138 | 1,608 | 1,842 | 2,084 | 1,953 | 1,838 | 1,844 | 1,890 | 1,933 | 1,591 | 1,718 | 1,831 |
| 2024 | 1,611 | |||||||||||
| - = No Data Reported; -- = Not Applicable; NA = Not Available; W = Withheld to avoid disclosure of individual company data. |
| Release Date: 3/29/2024 |
| Next Release Date: 4/30/2024 |