|
Download Data (XLS File) |
|
||||||||
|
||||||||
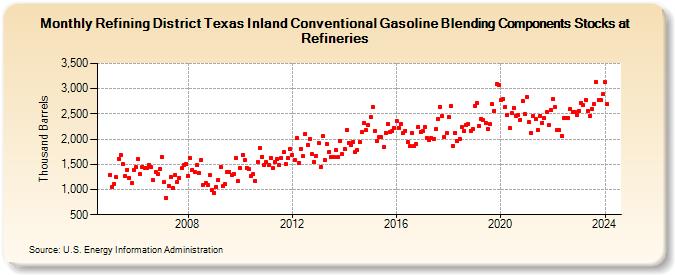
| Refining District Texas Inland Conventional Gasoline Blending Components Stocks at Refineries (Thousand Barrels) | ||||||||
| Year | Jan | Feb | Mar | Apr | May | Jun | Jul | Aug | Sep | Oct | Nov | Dec |
|---|---|---|---|---|---|---|---|---|---|---|---|---|
| 2005 | 1,289 | 1,055 | 1,114 | 1,242 | 1,613 | 1,678 | 1,499 | 1,267 | 1,392 | 1,232 | 1,120 | 1,383 |
| 2006 | 1,438 | 1,605 | 1,312 | 1,455 | 1,433 | 1,425 | 1,489 | 1,445 | 1,181 | 1,349 | 1,299 | 1,409 |
| 2007 | 1,640 | 1,143 | 838 | 1,073 | 1,251 | 1,024 | 1,290 | 1,149 | 1,238 | 1,426 | 1,485 | 1,508 |
| 2008 | 1,263 | 1,622 | 1,392 | 1,344 | 1,483 | 1,322 | 1,590 | 1,094 | 1,132 | 1,093 | 1,282 | 983 |
| 2009 | 934 | 1,054 | 1,193 | 1,448 | 1,060 | 1,101 | 1,345 | 1,352 | 1,295 | 1,314 | 1,628 | 1,159 |
| 2010 | 1,426 | 1,694 | 1,578 | 1,432 | 1,406 | 1,271 | 1,299 | 1,169 | 1,544 | 1,829 | 1,654 | 1,478 |
| 2011 | 1,537 | 1,477 | 1,633 | 1,433 | 1,546 | 1,599 | 1,479 | 1,629 | 1,735 | 1,503 | 1,620 | 1,807 |
| 2012 | 1,684 | 1,583 | 2,025 | 1,527 | 1,813 | 1,662 | 2,108 | 1,884 | 1,998 | 1,695 | 1,551 | 1,663 |
| 2013 | 1,918 | 1,438 | 2,055 | 1,580 | 1,898 | 1,751 | 1,649 | 1,644 | 1,789 | 1,643 | 1,963 | 1,702 |
| 2014 | 1,799 | 2,179 | 1,931 | 1,892 | 1,940 | 1,737 | 1,783 | 1,938 | 2,133 | 2,314 | 2,174 | 2,280 |
| 2015 | 2,440 | 2,644 | 2,152 | 1,960 | 2,038 | 2,036 | 1,835 | 2,122 | 2,298 | 2,132 | 2,165 | 2,226 |
| 2016 | 2,365 | 2,228 | 2,297 | 2,124 | 2,170 | 1,933 | 1,858 | 2,122 | 1,859 | 1,910 | 2,235 | 2,145 |
| 2017 | 2,154 | 2,249 | 2,012 | 1,980 | 2,022 | 2,008 | 2,194 | 2,406 | 2,643 | 2,449 | 2,045 | 2,125 |
| 2018 | 2,442 | 2,648 | 1,869 | 2,129 | 1,958 | 2,007 | 2,244 | 2,153 | 2,289 | 2,304 | 2,167 | 2,200 |
| 2019 | 2,659 | 2,713 | 2,264 | 2,402 | 2,372 | 2,313 | 2,198 | 2,292 | 2,688 | 2,563 | 3,086 | 3,073 |
| 2020 | 2,774 | 2,786 | 2,639 | 2,474 | 2,219 | 2,508 | 2,620 | 2,458 | 2,476 | 2,386 | 2,751 | 2,489 |
| 2021 | 2,833 | 2,336 | 2,130 | 2,461 | 2,395 | 2,186 | 2,466 | 2,328 | 2,418 | 2,531 | 2,271 | 2,583 |
| 2022 | 2,787 | 2,627 | 2,172 | 2,173 | 2,062 | 2,415 | 2,427 | 2,427 | 2,593 | 2,542 | 2,533 | 2,486 |
| 2023 | 2,563 | 2,723 | 2,670 | 2,771 | 2,564 | 2,465 | 2,599 | 2,697 | 3,135 | 2,779 | 2,778 | 2,886 |
| 2024 | 3,124 | |||||||||||
| - = No Data Reported; -- = Not Applicable; NA = Not Available; W = Withheld to avoid disclosure of individual company data. |
| Release Date: 3/29/2024 |
| Next Release Date: 4/30/2024 |