|
Download Data (XLS File) |
|
||||||||
|
||||||||
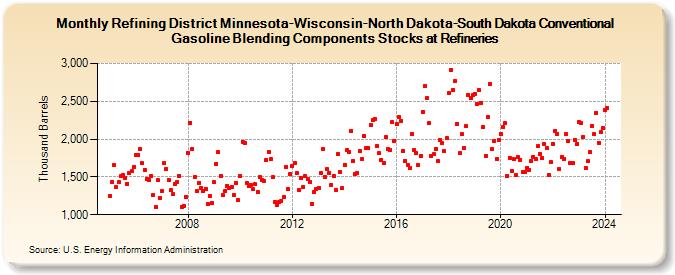
| Refining District Minnesota-Wisconsin-North Dakota-South Dakota Conventional Gasoline Blending Components Stocks at Refineries (Thousand Barrels) | ||||||||
| Year | Jan | Feb | Mar | Apr | May | Jun | Jul | Aug | Sep | Oct | Nov | Dec |
|---|---|---|---|---|---|---|---|---|---|---|---|---|
| 2005 | 1,253 | 1,433 | 1,652 | 1,360 | 1,427 | 1,508 | 1,525 | 1,489 | 1,411 | 1,546 | 1,573 | 1,633 |
| 2006 | 1,791 | 1,784 | 1,867 | 1,680 | 1,596 | 1,472 | 1,464 | 1,515 | 1,263 | 1,105 | 1,460 | 1,226 |
| 2007 | 1,308 | 1,680 | 1,607 | 1,461 | 1,322 | 1,268 | 1,408 | 1,434 | 1,517 | 1,105 | 1,119 | 1,240 |
| 2008 | 1,820 | 2,219 | 1,871 | 1,495 | 1,313 | 1,424 | 1,359 | 1,317 | 1,340 | 1,138 | 1,250 | 1,156 |
| 2009 | 1,427 | 1,675 | 1,826 | 1,515 | 1,256 | 1,314 | 1,386 | 1,352 | 1,367 | 1,267 | 1,425 | 1,192 |
| 2010 | 1,511 | 1,966 | 1,947 | 1,421 | 1,375 | 1,396 | 1,336 | 1,402 | 1,301 | 1,496 | 1,464 | 1,449 |
| 2011 | 1,723 | 1,832 | 1,732 | 1,494 | 1,166 | 1,126 | 1,164 | 1,184 | 1,239 | 1,636 | 1,345 | 1,538 |
| 2012 | 1,649 | 1,679 | 1,550 | 1,327 | 1,484 | 1,367 | 1,508 | 1,478 | 1,431 | 1,146 | 1,300 | 1,338 |
| 2013 | 1,355 | 1,546 | 1,865 | 1,500 | 1,598 | 1,558 | 1,393 | 1,507 | 1,331 | 1,803 | 1,562 | 1,348 |
| 2014 | 1,661 | 1,852 | 1,826 | 2,113 | 1,711 | 1,541 | 1,550 | 1,840 | 1,734 | 2,041 | 1,878 | 1,877 |
| 2015 | 2,187 | 2,252 | 2,268 | 1,903 | 1,811 | 1,727 | 1,679 | 2,022 | 1,866 | 1,856 | 2,220 | 1,981 |
| 2016 | 2,197 | 2,286 | 2,243 | 1,849 | 1,709 | 1,658 | 1,614 | 2,068 | 1,854 | 1,819 | 1,651 | 1,780 |
| 2017 | 2,364 | 2,703 | 2,540 | 2,210 | 1,776 | 1,799 | 1,873 | 1,713 | 1,983 | 1,952 | 1,837 | 2,009 |
| 2018 | 2,604 | 2,911 | 2,646 | 2,769 | 2,205 | 1,810 | 2,064 | 1,885 | 2,167 | 2,587 | 2,543 | 2,582 |
| 2019 | 2,602 | 2,464 | 2,649 | 2,474 | 2,159 | 1,780 | 2,292 | 2,730 | 1,869 | 1,977 | 1,742 | 1,990 |
| 2020 | 2,068 | 2,158 | 2,207 | 1,518 | 1,756 | 1,573 | 1,736 | 1,521 | 1,758 | 1,727 | 1,567 | 1,570 |
| 2021 | 1,624 | 1,597 | 1,711 | 1,767 | 1,740 | 1,903 | 1,804 | 1,752 | 1,936 | 1,880 | 1,530 | 1,692 |
| 2022 | 1,936 | 2,104 | 2,067 | 1,606 | 1,762 | 1,740 | 2,067 | 1,977 | 1,681 | 1,679 | 1,989 | 1,935 |
| 2023 | 2,222 | 2,216 | 2,028 | 1,617 | 1,704 | 1,830 | 2,174 | 2,063 | 2,351 | 1,952 | 2,096 | 2,153 |
| 2024 | 2,391 | |||||||||||
| - = No Data Reported; -- = Not Applicable; NA = Not Available; W = Withheld to avoid disclosure of individual company data. |
| Release Date: 3/29/2024 |
| Next Release Date: 4/30/2024 |