|
Download Data (XLS File) |
|
||||||||
|
||||||||
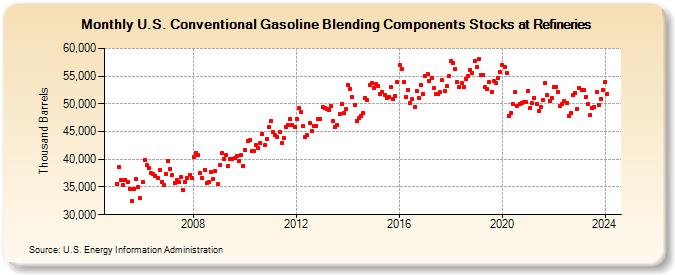
| U.S. Conventional Gasoline Blending Components Stocks at Refineries (Thousand Barrels) | ||||||||
| Year | Jan | Feb | Mar | Apr | May | Jun | Jul | Aug | Sep | Oct | Nov | Dec |
|---|---|---|---|---|---|---|---|---|---|---|---|---|
| 2005 | 35,546 | 38,540 | 36,349 | 35,361 | 36,342 | 35,919 | 34,617 | 32,543 | 34,639 | 36,467 | 35,019 | 32,927 |
| 2006 | 35,921 | 39,789 | 38,920 | 38,496 | 37,446 | 37,357 | 37,030 | 36,539 | 37,984 | 35,948 | 35,329 | 37,359 |
| 2007 | 39,678 | 38,261 | 37,112 | 35,786 | 36,308 | 35,855 | 36,764 | 34,467 | 35,886 | 36,551 | 37,190 | 36,704 |
| 2008 | 40,482 | 41,213 | 40,693 | 37,542 | 36,702 | 38,067 | 35,666 | 35,869 | 37,693 | 36,491 | 37,888 | 35,562 |
| 2009 | 38,913 | 41,065 | 40,113 | 40,688 | 38,837 | 40,022 | 40,113 | 40,197 | 40,569 | 39,729 | 40,721 | 38,829 |
| 2010 | 41,670 | 43,295 | 43,447 | 41,496 | 41,519 | 42,622 | 41,959 | 42,871 | 44,591 | 42,619 | 43,602 | 45,784 |
| 2011 | 46,949 | 44,910 | 44,289 | 43,938 | 44,859 | 42,949 | 43,848 | 45,896 | 46,095 | 47,192 | 46,241 | 45,744 |
| 2012 | 47,312 | 49,201 | 48,457 | 45,975 | 44,029 | 44,352 | 46,598 | 45,154 | 46,088 | 46,090 | 47,299 | 47,354 |
| 2013 | 49,501 | 49,336 | 49,146 | 48,884 | 49,645 | 46,860 | 45,895 | 46,152 | 48,178 | 49,884 | 48,389 | 49,029 |
| 2014 | 53,349 | 52,762 | 51,185 | 49,721 | 46,873 | 47,481 | 47,829 | 48,321 | 51,113 | 50,664 | 53,383 | 53,710 |
| 2015 | 52,940 | 53,543 | 53,170 | 51,758 | 52,084 | 51,656 | 51,122 | 51,218 | 52,972 | 50,909 | 51,417 | 53,924 |
| 2016 | 56,980 | 56,312 | 54,016 | 51,264 | 52,535 | 50,084 | 50,818 | 49,340 | 52,392 | 51,122 | 53,404 | 51,815 |
| 2017 | 55,021 | 55,412 | 54,095 | 54,717 | 52,812 | 51,722 | 51,763 | 52,064 | 54,263 | 52,359 | 53,175 | 55,005 |
| 2018 | 57,775 | 57,406 | 56,311 | 53,916 | 52,949 | 53,675 | 52,997 | 54,555 | 55,001 | 56,152 | 55,582 | 57,680 |
| 2019 | 56,673 | 58,035 | 55,262 | 55,252 | 52,969 | 52,640 | 53,874 | 52,144 | 54,032 | 53,741 | 54,696 | 55,722 |
| 2020 | 56,967 | 56,713 | 55,611 | 47,873 | 48,259 | 49,910 | 52,090 | 49,672 | 49,997 | 50,170 | 50,369 | 50,283 |
| 2021 | 52,342 | 49,290 | 50,118 | 51,118 | 50,041 | 48,794 | 49,491 | 50,637 | 53,680 | 51,537 | 50,531 | 51,136 |
| 2022 | 53,057 | 53,103 | 52,120 | 49,590 | 49,901 | 50,479 | 50,207 | 47,828 | 48,400 | 51,554 | 51,866 | 49,084 |
| 2023 | 52,854 | 52,514 | 52,449 | 51,288 | 49,962 | 47,985 | 49,288 | 49,454 | 52,056 | 49,804 | 50,896 | 52,491 |
| 2024 | 53,989 | |||||||||||
| - = No Data Reported; -- = Not Applicable; NA = Not Available; W = Withheld to avoid disclosure of individual company data. |
| Release Date: 3/29/2024 |
| Next Release Date: 4/30/2024 |