|
Download Data (XLS File) |
|
||||||||
|
||||||||
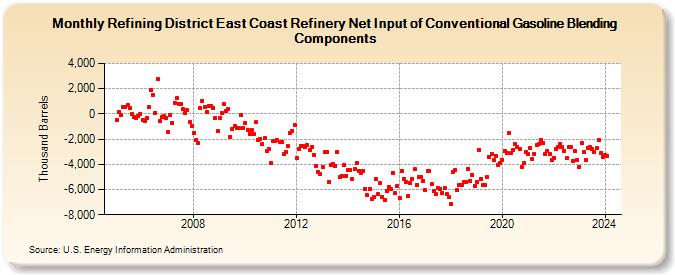
| Refining District East Coast Refinery Net Input of Conventional Gasoline Blending Components (Thousand Barrels) | ||||||||
| Year | Jan | Feb | Mar | Apr | May | Jun | Jul | Aug | Sep | Oct | Nov | Dec |
|---|---|---|---|---|---|---|---|---|---|---|---|---|
| 2005 | -447 | 167 | -109 | 534 | 537 | 686 | 487 | -1 | -239 | -323 | -187 | 13 |
| 2006 | -456 | -563 | -321 | 555 | 1,930 | 1,489 | 105 | 2,770 | -584 | -240 | -169 | -347 |
| 2007 | -1,470 | -57 | -694 | 850 | 1,226 | 786 | 782 | 365 | 66 | 272 | -664 | -966 |
| 2008 | -1,505 | -2,103 | -2,287 | 440 | 1,059 | 559 | 116 | 654 | 628 | 461 | -323 | -1,369 |
| 2009 | -335 | 40 | 769 | 212 | 391 | -1,803 | -1,183 | -923 | -1,122 | -1,151 | -90 | -1,090 |
| 2010 | -717 | -1,283 | -1,604 | -1,299 | -1,633 | -650 | -2,061 | -1,988 | -2,384 | -1,939 | -2,971 | -2,821 |
| 2011 | -3,915 | -2,148 | -2,116 | -2,092 | -2,252 | -2,238 | -3,188 | -2,993 | -2,551 | -1,536 | -1,318 | -890 |
| 2012 | -3,523 | -2,790 | -2,516 | -2,522 | -2,629 | -2,477 | -2,891 | -2,645 | -3,257 | -4,154 | -4,582 | -4,799 |
| 2013 | -4,249 | -3,047 | -3,007 | -5,389 | -4,086 | -3,982 | -4,107 | -3,058 | -5,046 | -4,911 | -4,043 | -4,918 |
| 2014 | -4,465 | -4,468 | -5,156 | -4,410 | -3,886 | -4,517 | -4,651 | -4,501 | -5,948 | -6,458 | -5,956 | -6,752 |
| 2015 | -6,597 | -5,162 | -6,362 | -5,508 | -6,583 | -6,796 | -6,093 | -5,787 | -5,927 | -4,703 | -6,299 | -5,703 |
| 2016 | -6,639 | -4,525 | -5,141 | -5,407 | -6,496 | -5,451 | -5,159 | -4,400 | -5,647 | -5,047 | -5,005 | -5,363 |
| 2017 | -6,077 | -4,526 | -4,566 | -5,597 | -6,150 | -6,352 | -5,898 | -5,975 | -6,273 | -5,885 | -6,381 | -6,583 |
| 2018 | -7,157 | -4,588 | -4,465 | -6,076 | -5,634 | -5,655 | -5,441 | -5,386 | -4,338 | -5,320 | -4,841 | -5,713 |
| 2019 | -5,423 | -2,844 | -5,168 | -5,665 | -5,657 | -5,033 | -3,446 | -3,159 | -3,670 | -3,315 | -4,063 | -3,884 |
| 2020 | -3,626 | -2,959 | -3,099 | -1,506 | -3,125 | -2,874 | -2,359 | -2,594 | -2,804 | -4,222 | -3,907 | -3,003 |
| 2021 | -3,210 | -2,675 | -3,581 | -3,144 | -2,481 | -2,422 | -2,039 | -2,276 | -3,156 | -2,976 | -3,153 | -3,689 |
| 2022 | -3,464 | -2,798 | -2,620 | -2,380 | -2,633 | -2,935 | -3,528 | -2,661 | -2,621 | -3,738 | -2,984 | -3,656 |
| 2023 | -4,228 | -2,316 | -2,993 | -3,667 | -2,673 | -2,645 | -2,824 | -3,020 | -2,723 | -2,086 | -3,076 | -3,398 |
| 2024 | -3,270 | |||||||||||
| - = No Data Reported; -- = Not Applicable; NA = Not Available; W = Withheld to avoid disclosure of individual company data. |
| Release Date: 3/29/2024 |
| Next Release Date: 4/30/2024 |