|
Download Data (XLS File) |
|
||||||||
|
||||||||
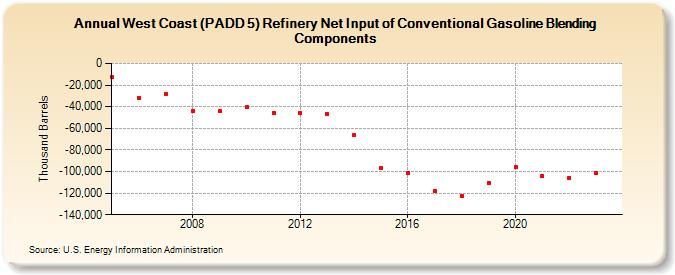
| West Coast (PADD 5) Refinery Net Input of Conventional Gasoline Blending Components (Thousand Barrels) | ||||||||
| Decade | Year-0 | Year-1 | Year-2 | Year-3 | Year-4 | Year-5 | Year-6 | Year-7 | Year-8 | Year-9 |
|---|---|---|---|---|---|---|---|---|---|---|
| 2000's | -12,340 | -31,621 | -27,882 | -43,872 | -44,023 | |||||
| 2010's | -40,425 | -45,528 | -45,722 | -46,885 | -66,051 | -96,593 | -101,757 | -117,921 | -122,590 | -110,422 |
| 2020's | -95,915 | -104,344 | -105,830 | -101,697 |
| - = No Data Reported; -- = Not Applicable; NA = Not Available; W = Withheld to avoid disclosure of individual company data. |
| Release Date: 3/29/2024 |
| Next Release Date: 8/30/2024 |