|
Download Data (XLS File) |
|
||||||||
|
||||||||
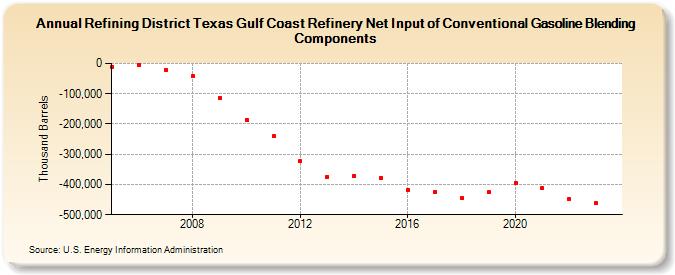
| Refining District Texas Gulf Coast Refinery Net Input of Conventional Gasoline Blending Components (Thousand Barrels) | ||||||||
| Decade | Year-0 | Year-1 | Year-2 | Year-3 | Year-4 | Year-5 | Year-6 | Year-7 | Year-8 | Year-9 |
|---|---|---|---|---|---|---|---|---|---|---|
| 2000's | -10,309 | -3,951 | -20,247 | -42,863 | -113,524 | |||||
| 2010's | -185,919 | -240,306 | -322,780 | -375,264 | -371,090 | -377,808 | -417,132 | -424,057 | -444,741 | -425,508 |
| 2020's | -395,258 | -413,081 | -448,731 | -462,124 |
| - = No Data Reported; -- = Not Applicable; NA = Not Available; W = Withheld to avoid disclosure of individual company data. |
| Release Date: 3/29/2024 |
| Next Release Date: 8/30/2024 |