|
Download Data (XLS File) |
|
||||||||
|
||||||||
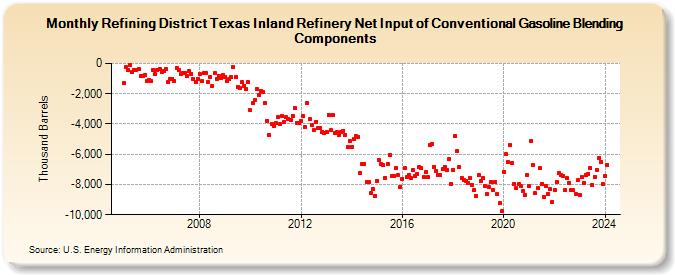
| Refining District Texas Inland Refinery Net Input of Conventional Gasoline Blending Components (Thousand Barrels) | ||||||||
| Year | Jan | Feb | Mar | Apr | May | Jun | Jul | Aug | Sep | Oct | Nov | Dec |
|---|---|---|---|---|---|---|---|---|---|---|---|---|
| 2005 | -1,307 | -265 | -449 | -118 | -563 | -449 | -403 | -373 | -808 | -819 | -749 | -1,183 |
| 2006 | -1,061 | -1,170 | -429 | -725 | -411 | -351 | -562 | -513 | -380 | -1,214 | -1,006 | -1,019 |
| 2007 | -1,156 | -282 | -444 | -703 | -662 | -644 | -860 | -473 | -666 | -1,039 | -1,237 | -1,010 |
| 2008 | -724 | -1,167 | -619 | -606 | -1,224 | -901 | -1,464 | -649 | -1,001 | -806 | -985 | -737 |
| 2009 | -883 | -1,138 | -1,046 | -913 | -248 | -916 | -1,535 | -1,653 | -1,257 | -1,464 | -1,713 | -1,251 |
| 2010 | -3,095 | -2,604 | -2,428 | -1,699 | -2,052 | -1,817 | -1,903 | -2,634 | -3,778 | -4,732 | -4,006 | -4,127 |
| 2011 | -3,958 | -3,564 | -4,027 | -3,453 | -3,850 | -3,567 | -3,655 | -3,730 | -3,454 | -2,952 | -3,941 | -3,949 |
| 2012 | -3,771 | -3,492 | -4,204 | -2,639 | -3,702 | -4,094 | -4,428 | -3,858 | -4,249 | -4,263 | -4,512 | -4,629 |
| 2013 | -4,536 | -3,383 | -4,421 | -3,431 | -4,579 | -4,563 | -4,702 | -4,550 | -4,440 | -4,697 | -5,538 | -5,101 |
| 2014 | -5,530 | -4,968 | -4,825 | -4,844 | -7,242 | -6,662 | -6,617 | -7,815 | -7,836 | -8,576 | -8,308 | -8,754 |
| 2015 | -7,743 | -6,384 | -6,646 | -6,732 | -7,543 | -6,630 | -6,053 | -7,472 | -7,431 | -6,939 | -7,404 | -8,150 |
| 2016 | -7,631 | -6,922 | -7,512 | -7,371 | -7,595 | -7,027 | -7,438 | -7,297 | -6,858 | -6,916 | -7,508 | -7,202 |
| 2017 | -7,524 | -5,388 | -5,331 | -6,812 | -7,113 | -7,357 | -7,393 | -6,980 | -6,813 | -7,048 | -6,343 | -7,965 |
| 2018 | -7,014 | -4,791 | -5,777 | -6,874 | -7,571 | -7,684 | -7,749 | -7,883 | -7,597 | -8,016 | -8,337 | -8,743 |
| 2019 | -7,383 | -7,802 | -7,561 | -8,072 | -8,644 | -8,162 | -7,842 | -8,379 | -7,838 | -8,641 | -9,239 | -9,769 |
| 2020 | -7,155 | -6,007 | -6,530 | -5,403 | -6,601 | -7,960 | -8,256 | -7,998 | -8,134 | -8,414 | -8,713 | -7,341 |
| 2021 | -8,117 | -5,134 | -6,705 | -8,593 | -8,236 | -6,933 | -7,950 | -8,810 | -8,116 | -8,620 | -8,301 | -9,151 |
| 2022 | -8,348 | -7,825 | -7,265 | -7,401 | -7,425 | -8,392 | -7,581 | -7,895 | -8,396 | -8,388 | -8,625 | -7,732 |
| 2023 | -8,677 | -7,515 | -7,877 | -7,395 | -7,305 | -6,905 | -8,044 | -7,474 | -7,038 | -6,231 | -6,483 | -7,981 |
| 2024 | -7,418 | |||||||||||
| - = No Data Reported; -- = Not Applicable; NA = Not Available; W = Withheld to avoid disclosure of individual company data. |
| Release Date: 3/29/2024 |
| Next Release Date: 4/30/2024 |