|
Download Data (XLS File) |
|
||||||||
|
||||||||
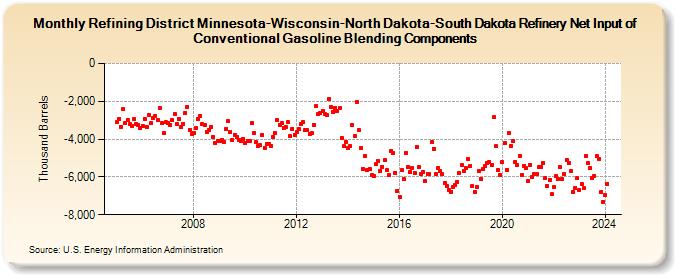
| Refining District Minnesota-Wisconsin-North Dakota-South Dakota Refinery Net Input of Conventional Gasoline Blending Components (Thousand Barrels) | ||||||||
| Year | Jan | Feb | Mar | Apr | May | Jun | Jul | Aug | Sep | Oct | Nov | Dec |
|---|---|---|---|---|---|---|---|---|---|---|---|---|
| 2005 | -3,120 | -2,915 | -3,341 | -2,423 | -3,174 | -3,002 | -3,227 | -3,306 | -2,958 | -3,201 | -3,237 | -3,389 |
| 2006 | -3,296 | -2,921 | -3,375 | -2,700 | -3,137 | -2,882 | -2,755 | -3,012 | -2,367 | -3,171 | -3,688 | -3,119 |
| 2007 | -3,167 | -3,255 | -3,008 | -2,678 | -3,226 | -2,914 | -3,351 | -3,196 | -2,613 | -2,284 | -3,507 | -3,746 |
| 2008 | -3,673 | -3,426 | -2,949 | -2,753 | -3,227 | -3,247 | -3,606 | -3,499 | -3,334 | -3,865 | -4,227 | -4,096 |
| 2009 | -4,104 | -4,036 | -4,133 | -3,442 | -3,061 | -3,636 | -4,055 | -3,769 | -3,880 | -4,026 | -4,083 | -3,977 |
| 2010 | -4,180 | -4,112 | -4,099 | -3,148 | -3,675 | -4,179 | -4,391 | -4,329 | -3,776 | -4,462 | -4,236 | -4,262 |
| 2011 | -4,362 | -3,886 | -3,675 | -2,990 | -3,249 | -3,174 | -3,396 | -3,371 | -3,118 | -3,860 | -3,449 | -3,760 |
| 2012 | -3,628 | -3,486 | -3,223 | -3,103 | -3,529 | -3,533 | -3,743 | -3,701 | -3,229 | -2,224 | -2,684 | -2,595 |
| 2013 | -2,521 | -2,671 | -2,723 | -1,872 | -2,297 | -2,542 | -2,356 | -2,535 | -2,342 | -3,929 | -4,367 | -4,142 |
| 2014 | -4,493 | -4,380 | -3,233 | -3,858 | -2,035 | -3,521 | -4,446 | -5,575 | -4,894 | -5,612 | -5,575 | -5,915 |
| 2015 | -5,972 | -5,336 | -5,157 | -5,669 | -5,451 | -5,122 | -5,649 | -5,893 | -4,608 | -4,719 | -5,775 | -6,725 |
| 2016 | -7,038 | -5,638 | -6,101 | -4,724 | -5,490 | -5,750 | -5,527 | -5,816 | -4,423 | -5,502 | -5,822 | -5,748 |
| 2017 | -6,241 | -5,834 | -5,872 | -4,161 | -4,501 | -5,869 | -5,525 | -5,675 | -5,871 | -6,339 | -6,501 | -6,687 |
| 2018 | -6,776 | -6,536 | -6,435 | -6,250 | -5,811 | -5,392 | -5,672 | -5,524 | -5,071 | -5,420 | -6,494 | -6,775 |
| 2019 | -6,525 | -5,667 | -6,106 | -5,569 | -5,441 | -5,274 | -5,217 | -5,395 | -2,852 | -4,381 | -5,650 | -5,894 |
| 2020 | -5,206 | -4,196 | -5,616 | -3,673 | -4,356 | -4,110 | -5,223 | -5,375 | -4,882 | -5,892 | -5,397 | -5,545 |
| 2021 | -6,227 | -5,347 | -5,990 | -5,848 | -5,861 | -5,491 | -5,462 | -5,252 | -6,037 | -6,459 | -6,173 | -6,917 |
| 2022 | -6,532 | -5,965 | -6,125 | -5,494 | -6,116 | -5,846 | -5,105 | -5,253 | -5,676 | -6,808 | -6,570 | -6,072 |
| 2023 | -6,677 | -6,359 | -6,611 | -4,899 | -5,265 | -5,530 | -6,053 | -5,934 | -4,917 | -5,046 | -6,824 | -7,311 |
| 2024 | -6,982 | -6,351 | -6,456 | -5,507 | -6,041 | -4,740 | ||||||
| - = No Data Reported; -- = Not Applicable; NA = Not Available; W = Withheld to avoid disclosure of individual company data. |
| Release Date: 8/30/2024 |
| Next Release Date: 9/30/2024 |