|
Download Data (XLS File) |
|
||||||||
|
||||||||
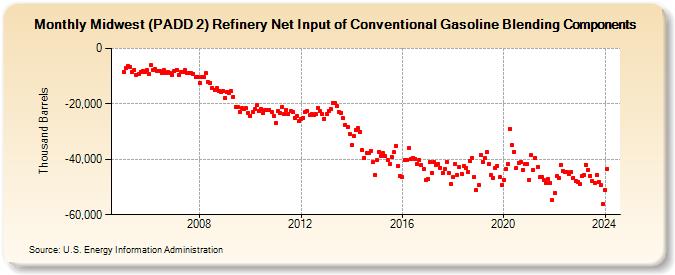
| Midwest (PADD 2) Refinery Net Input of Conventional Gasoline Blending Components (Thousand Barrels) | ||||||||
| Year | Jan | Feb | Mar | Apr | May | Jun | Jul | Aug | Sep | Oct | Nov | Dec |
|---|---|---|---|---|---|---|---|---|---|---|---|---|
| 2005 | -8,423 | -7,113 | -6,359 | -6,594 | -8,511 | -7,667 | -9,454 | -9,204 | -8,513 | -8,200 | -8,433 | -7,896 |
| 2006 | -9,238 | -6,156 | -7,679 | -7,551 | -8,256 | -8,003 | -8,895 | -7,887 | -8,833 | -8,436 | -8,823 | -9,548 |
| 2007 | -8,059 | -7,699 | -9,620 | -8,695 | -8,577 | -7,859 | -8,927 | -8,872 | -8,908 | -9,113 | -10,220 | -10,323 |
| 2008 | -12,423 | -10,448 | -10,353 | -9,027 | -12,267 | -12,343 | -14,270 | -14,864 | -14,234 | -15,213 | -15,865 | -15,309 |
| 2009 | -17,772 | -15,759 | -16,068 | -15,504 | -17,406 | -21,206 | -21,241 | -22,782 | -21,602 | -21,704 | -21,684 | -23,197 |
| 2010 | -24,253 | -22,992 | -21,998 | -20,539 | -22,572 | -22,004 | -23,360 | -22,364 | -22,084 | -22,102 | -23,124 | -24,368 |
| 2011 | -26,902 | -22,739 | -23,235 | -21,193 | -23,526 | -22,174 | -23,829 | -22,618 | -23,012 | -24,979 | -24,262 | -26,292 |
| 2012 | -25,297 | -25,052 | -22,870 | -22,482 | -24,044 | -23,552 | -24,156 | -23,513 | -21,413 | -22,622 | -23,742 | -25,341 |
| 2013 | -23,784 | -22,551 | -21,708 | -19,590 | -19,633 | -20,896 | -22,792 | -23,152 | -25,264 | -27,576 | -28,520 | -30,749 |
| 2014 | -34,943 | -31,545 | -29,355 | -28,870 | -30,107 | -36,694 | -39,436 | -37,587 | -37,886 | -36,837 | -41,108 | -45,510 |
| 2015 | -40,111 | -37,245 | -38,886 | -37,915 | -38,851 | -40,199 | -41,819 | -39,007 | -37,512 | -35,302 | -42,282 | -46,025 |
| 2016 | -46,403 | -40,358 | -40,266 | -35,942 | -39,778 | -39,473 | -39,725 | -41,751 | -40,348 | -42,176 | -43,567 | -47,400 |
| 2017 | -47,099 | -40,855 | -44,877 | -41,046 | -41,997 | -41,697 | -43,040 | -44,909 | -43,509 | -40,834 | -44,851 | -48,987 |
| 2018 | -46,535 | -41,706 | -45,610 | -42,789 | -45,201 | -42,320 | -43,151 | -44,667 | -40,668 | -39,390 | -46,277 | -51,204 |
| 2019 | -49,451 | -38,316 | -40,972 | -39,578 | -37,438 | -41,843 | -45,586 | -46,644 | -43,188 | -42,382 | -46,544 | -49,253 |
| 2020 | -47,429 | -43,529 | -41,853 | -28,939 | -34,943 | -37,236 | -43,048 | -41,235 | -40,820 | -43,772 | -41,755 | -41,733 |
| 2021 | -47,313 | -38,456 | -43,725 | -39,535 | -42,714 | -46,486 | -46,313 | -47,381 | -48,428 | -47,153 | -48,631 | -54,734 |
| 2022 | -52,182 | -46,188 | -46,679 | -41,888 | -44,294 | -44,630 | -44,750 | -45,376 | -44,600 | -46,629 | -47,945 | -48,249 |
| 2023 | -49,061 | -46,209 | -45,644 | -41,899 | -43,725 | -45,863 | -47,812 | -48,416 | -45,690 | -48,094 | -49,396 | -56,172 |
| 2024 | -51,137 | |||||||||||
| - = No Data Reported; -- = Not Applicable; NA = Not Available; W = Withheld to avoid disclosure of individual company data. |
| Release Date: 3/29/2024 |
| Next Release Date: 4/30/2024 |