|
Download Data (XLS File) |
|
||||||||
|
||||||||
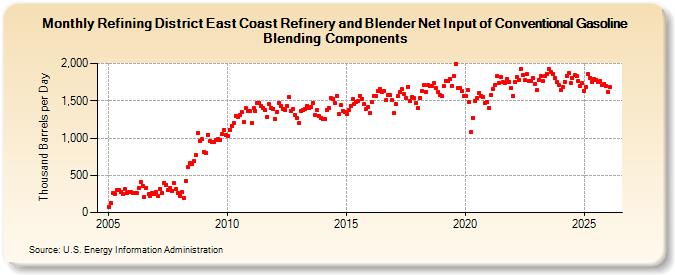
| Refining District East Coast Refinery and Blender Net Input of Conventional Gasoline Blending Components (Thousand Barrels per Day) | ||||||||
| Year | Jan | Feb | Mar | Apr | May | Jun | Jul | Aug | Sep | Oct | Nov | Dec |
|---|---|---|---|---|---|---|---|---|---|---|---|---|
| 2005 | 78 | 127 | 266 | 246 | 300 | 305 | 279 | 246 | 318 | 262 | 274 | 271 |
| 2006 | 263 | 262 | 263 | 331 | 405 | 360 | 212 | 333 | 247 | 224 | 265 | 252 |
| 2007 | 274 | 216 | 317 | 261 | 401 | 374 | 299 | 336 | 295 | 395 | 322 | 264 |
| 2008 | 226 | 270 | 198 | 421 | 609 | 664 | 649 | 693 | 770 | 1,067 | 961 | 983 |
| 2009 | 810 | 799 | 1,047 | 955 | 951 | 946 | 974 | 981 | 969 | 1,050 | 1,111 | 1,035 |
| 2010 | 1,028 | 1,113 | 1,166 | 1,201 | 1,295 | 1,288 | 1,307 | 1,350 | 1,212 | 1,399 | 1,367 | 1,359 |
| 2011 | 1,205 | 1,406 | 1,362 | 1,476 | 1,474 | 1,434 | 1,404 | 1,376 | 1,288 | 1,450 | 1,406 | 1,393 |
| 2012 | 1,259 | 1,354 | 1,474 | 1,431 | 1,390 | 1,373 | 1,431 | 1,552 | 1,357 | 1,386 | 1,309 | 1,271 |
| 2013 | 1,208 | 1,359 | 1,374 | 1,385 | 1,423 | 1,407 | 1,413 | 1,467 | 1,309 | 1,378 | 1,296 | 1,270 |
| 2014 | 1,261 | 1,254 | 1,379 | 1,405 | 1,535 | 1,530 | 1,475 | 1,569 | 1,322 | 1,438 | 1,361 | 1,345 |
| 2015 | 1,321 | 1,381 | 1,433 | 1,522 | 1,457 | 1,486 | 1,500 | 1,559 | 1,528 | 1,455 | 1,393 | 1,417 |
| 2016 | 1,339 | 1,481 | 1,567 | 1,558 | 1,628 | 1,656 | 1,616 | 1,637 | 1,514 | 1,578 | 1,572 | 1,506 |
| 2017 | 1,330 | 1,462 | 1,565 | 1,620 | 1,655 | 1,592 | 1,533 | 1,687 | 1,495 | 1,552 | 1,532 | 1,473 |
| 2018 | 1,407 | 1,540 | 1,636 | 1,716 | 1,618 | 1,711 | 1,697 | 1,701 | 1,732 | 1,675 | 1,620 | 1,581 |
| 2019 | 1,564 | 1,693 | 1,771 | 1,766 | 1,791 | 1,694 | 1,827 | 1,989 | 1,677 | 1,669 | 1,627 | 1,565 |
| 2020 | 1,563 | 1,646 | 1,477 | 1,078 | 1,271 | 1,497 | 1,535 | 1,605 | 1,570 | 1,544 | 1,472 | 1,485 |
| 2021 | 1,408 | 1,572 | 1,655 | 1,718 | 1,826 | 1,739 | 1,824 | 1,745 | 1,740 | 1,798 | 1,754 | 1,669 |
| 2022 | 1,561 | 1,757 | 1,814 | 1,781 | 1,931 | 1,847 | 1,772 | 1,853 | 1,771 | 1,765 | 1,804 | 1,728 |
| 2023 | 1,638 | 1,776 | 1,852 | 1,764 | 1,826 | 1,865 | 1,925 | 1,884 | 1,854 | 1,806 | 1,746 | 1,708 |
| 2024 | 1,650 | |||||||||||
| - = No Data Reported; -- = Not Applicable; NA = Not Available; W = Withheld to avoid disclosure of individual company data. |
| Release Date: 3/29/2024 |
| Next Release Date: 4/30/2024 |