|
Download Data (XLS File) |
|
||||||||
|
||||||||
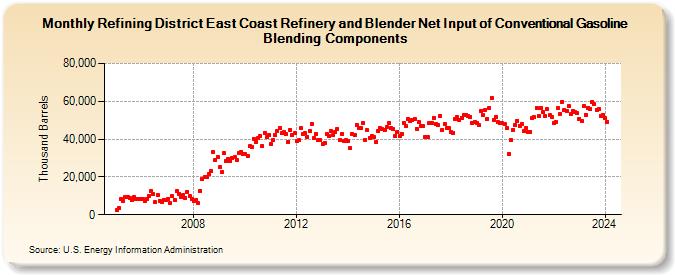
| Refining District East Coast Refinery and Blender Net Input of Conventional Gasoline Blending Components (Thousand Barrels) | ||||||||
| Year | Jan | Feb | Mar | Apr | May | Jun | Jul | Aug | Sep | Oct | Nov | Dec |
|---|---|---|---|---|---|---|---|---|---|---|---|---|
| 2005 | 2,433 | 3,549 | 8,237 | 7,368 | 9,291 | 9,136 | 8,662 | 7,612 | 9,526 | 8,136 | 8,213 | 8,397 |
| 2006 | 8,151 | 7,324 | 8,147 | 9,928 | 12,559 | 10,793 | 6,576 | 10,312 | 7,399 | 6,958 | 7,949 | 7,826 |
| 2007 | 8,503 | 6,054 | 9,834 | 7,838 | 12,433 | 11,216 | 9,272 | 10,430 | 8,857 | 12,233 | 9,672 | 8,170 |
| 2008 | 7,020 | 7,820 | 6,127 | 12,635 | 18,889 | 19,905 | 20,114 | 21,480 | 23,090 | 33,072 | 28,822 | 30,473 |
| 2009 | 25,096 | 22,378 | 32,454 | 28,646 | 29,494 | 28,372 | 30,206 | 30,402 | 29,067 | 32,543 | 33,330 | 32,090 |
| 2010 | 31,862 | 31,165 | 36,159 | 36,035 | 40,133 | 38,643 | 40,506 | 41,863 | 36,358 | 43,360 | 41,006 | 42,125 |
| 2011 | 37,355 | 39,366 | 42,237 | 44,288 | 45,707 | 43,009 | 43,509 | 42,667 | 38,647 | 44,951 | 42,191 | 43,184 |
| 2012 | 39,034 | 39,266 | 45,686 | 42,922 | 43,098 | 41,175 | 44,366 | 48,122 | 40,722 | 42,951 | 39,264 | 39,408 |
| 2013 | 37,446 | 38,046 | 42,607 | 41,538 | 44,123 | 42,220 | 43,815 | 45,478 | 39,268 | 42,725 | 38,870 | 39,377 |
| 2014 | 39,102 | 35,123 | 42,750 | 42,149 | 47,597 | 45,891 | 45,716 | 48,648 | 39,656 | 44,592 | 40,829 | 41,680 |
| 2015 | 40,956 | 38,673 | 44,426 | 45,664 | 45,178 | 44,570 | 46,511 | 48,318 | 45,826 | 45,104 | 41,791 | 43,939 |
| 2016 | 41,513 | 42,935 | 48,587 | 46,754 | 50,457 | 49,677 | 50,105 | 50,756 | 45,415 | 48,913 | 47,160 | 46,687 |
| 2017 | 41,229 | 40,942 | 48,524 | 48,601 | 51,313 | 47,762 | 47,532 | 52,289 | 44,836 | 48,104 | 45,962 | 45,670 |
| 2018 | 43,618 | 43,122 | 50,716 | 51,474 | 50,172 | 51,329 | 52,617 | 52,745 | 51,968 | 51,928 | 48,610 | 49,015 |
| 2019 | 48,479 | 47,403 | 54,894 | 52,977 | 55,528 | 50,823 | 56,652 | 61,669 | 50,310 | 51,751 | 48,810 | 48,513 |
| 2020 | 48,464 | 47,738 | 45,786 | 32,349 | 39,387 | 44,916 | 47,596 | 49,743 | 47,101 | 47,860 | 44,156 | 46,046 |
| 2021 | 43,648 | 44,007 | 51,294 | 51,529 | 56,604 | 52,177 | 56,557 | 54,102 | 52,205 | 55,734 | 52,614 | 51,727 |
| 2022 | 48,376 | 49,196 | 56,246 | 53,425 | 59,856 | 55,420 | 54,938 | 57,438 | 53,118 | 54,721 | 54,128 | 53,565 |
| 2023 | 50,763 | 49,739 | 57,410 | 52,934 | 56,609 | 55,949 | 59,682 | 58,393 | 55,628 | 55,977 | 52,388 | 52,959 |
| 2024 | 51,149 | 49,193 | ||||||||||
| - = No Data Reported; -- = Not Applicable; NA = Not Available; W = Withheld to avoid disclosure of individual company data. |
| Release Date: 4/30/2024 |
| Next Release Date: 5/31/2024 |