|
Download Data (XLS File) |
|
||||||||
|
||||||||
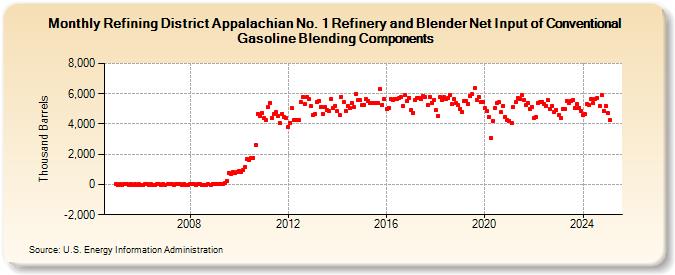
| Refining District Appalachian No. 1 Refinery and Blender Net Input of Conventional Gasoline Blending Components (Thousand Barrels) | ||||||||
| Year | Jan | Feb | Mar | Apr | May | Jun | Jul | Aug | Sep | Oct | Nov | Dec |
|---|---|---|---|---|---|---|---|---|---|---|---|---|
| 2005 | 6 | -15 | 11 | -9 | 0 | 3 | -4 | 0 | -3 | 2 | -11 | 8 |
| 2006 | -8 | -7 | 13 | -1 | -7 | 2 | -3 | -3 | -2 | 0 | -5 | -2 |
| 2007 | -8 | -2 | 4 | 5 | -22 | 3 | 7 | -1 | -3 | 2 | -7 | -12 |
| 2008 | 2 | -1 | 6 | -4 | 1 | 7 | -7 | -16 | -9 | 9 | -6 | 20 |
| 2009 | 16 | 24 | 12 | 33 | 25 | 74 | 222 | 779 | 699 | 834 | 755 | 809 |
| 2010 | 879 | 849 | 941 | 1,140 | 1,668 | 1,599 | 1,754 | 1,778 | 2,607 | 4,689 | 4,538 | 4,750 |
| 2011 | 4,368 | 4,257 | 5,099 | 5,407 | 4,370 | 4,668 | 4,761 | 4,523 | 4,045 | 4,676 | 4,462 | 4,413 |
| 2012 | 3,830 | 4,090 | 5,026 | 4,250 | 4,263 | 4,288 | 5,444 | 5,753 | 5,314 | 5,752 | 5,681 | 5,162 |
| 2013 | 4,588 | 4,670 | 5,429 | 5,548 | 5,141 | 4,688 | 5,124 | 4,904 | 4,832 | 5,674 | 5,088 | 5,207 |
| 2014 | 4,828 | 4,574 | 5,787 | 5,473 | 4,886 | 5,163 | 5,084 | 5,401 | 5,091 | 5,999 | 5,561 | 5,581 |
| 2015 | 5,253 | 5,274 | 5,631 | 5,536 | 5,385 | 5,373 | 5,407 | 5,385 | 5,392 | 6,323 | 5,281 | 5,641 |
| 2016 | 4,983 | 5,066 | 5,651 | 5,567 | 5,670 | 5,680 | 5,695 | 5,772 | 5,218 | 5,913 | 5,499 | 5,736 |
| 2017 | 4,944 | 4,746 | 5,572 | 5,698 | 5,718 | 5,623 | 5,865 | 5,757 | 5,246 | 5,768 | 5,411 | 5,553 |
| 2018 | 4,905 | 4,529 | 5,753 | 5,553 | 5,776 | 5,631 | 5,696 | 5,920 | 5,319 | 5,648 | 5,384 | 5,241 |
| 2019 | 4,977 | 4,804 | 5,501 | 5,505 | 5,339 | 5,839 | 5,961 | 6,376 | 5,613 | 5,814 | 5,422 | 5,454 |
| 2020 | 5,040 | 4,850 | 4,446 | 3,083 | 4,227 | 5,062 | 5,417 | 5,421 | 4,767 | 5,217 | 4,480 | 4,262 |
| 2021 | 4,201 | 4,035 | 5,136 | 5,433 | 5,729 | 5,625 | 5,901 | 5,579 | 5,254 | 5,386 | 5,016 | 5,134 |
| 2022 | 4,428 | 4,477 | 5,417 | 5,465 | 5,448 | 5,347 | 5,206 | 5,584 | 5,016 | 5,199 | 4,793 | 4,934 |
| 2023 | 4,537 | 4,339 | 4,923 | 4,918 | 5,440 | 5,292 | 5,512 | 5,597 | 5,137 | 5,290 | 5,078 | 4,877 |
| 2024 | 4,562 | 4,632 | ||||||||||
| - = No Data Reported; -- = Not Applicable; NA = Not Available; W = Withheld to avoid disclosure of individual company data. |
| Release Date: 4/30/2024 |
| Next Release Date: 5/31/2024 |