|
Download Data (XLS File) |
|
||||||||
|
||||||||
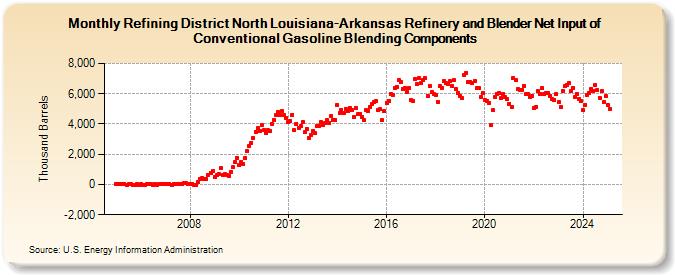
| Refining District North Louisiana-Arkansas Refinery and Blender Net Input of Conventional Gasoline Blending Components (Thousand Barrels) | ||||||||
| Year | Jan | Feb | Mar | Apr | May | Jun | Jul | Aug | Sep | Oct | Nov | Dec |
|---|---|---|---|---|---|---|---|---|---|---|---|---|
| 2005 | -1 | 12 | 13 | 2 | 32 | -34 | 4 | 35 | -25 | -15 | 31 | -12 |
| 2006 | 26 | -13 | -37 | 11 | -2 | 31 | -50 | 13 | -6 | 12 | 9 | 24 |
| 2007 | 21 | 33 | 44 | -16 | 51 | 14 | 14 | 50 | 34 | 89 | 80 | 48 |
| 2008 | 2 | 51 | -24 | -14 | 176 | 360 | 422 | 373 | 361 | 657 | 787 | 884 |
| 2009 | 507 | 602 | 725 | 1,073 | 657 | 685 | 649 | 589 | 847 | 1,133 | 1,501 | 1,729 |
| 2010 | 1,262 | 1,510 | 1,386 | 1,749 | 2,199 | 2,521 | 2,770 | 3,080 | 3,490 | 3,710 | 3,555 | 3,905 |
| 2011 | 3,589 | 3,384 | 3,580 | 3,548 | 4,015 | 4,290 | 4,570 | 4,809 | 4,580 | 4,850 | 4,571 | 4,421 |
| 2012 | 4,139 | 4,182 | 4,623 | 3,572 | 4,020 | 3,756 | 3,848 | 4,146 | 3,446 | 3,689 | 3,079 | 3,256 |
| 2013 | 3,509 | 3,432 | 3,873 | 3,877 | 4,118 | 3,923 | 4,039 | 4,251 | 4,094 | 4,511 | 4,249 | 4,258 |
| 2014 | 5,272 | 4,733 | 4,931 | 4,727 | 5,011 | 4,844 | 5,065 | 4,956 | 4,443 | 5,076 | 4,635 | 4,684 |
| 2015 | 4,482 | 4,233 | 4,901 | 4,870 | 5,136 | 5,322 | 5,446 | 5,510 | 4,919 | 4,962 | 4,235 | 4,829 |
| 2016 | 5,389 | 5,545 | 5,978 | 5,909 | 6,382 | 6,458 | 6,880 | 6,767 | 6,302 | 6,395 | 6,144 | 6,380 |
| 2017 | 5,583 | 5,552 | 6,975 | 6,627 | 7,019 | 6,730 | 6,884 | 7,007 | 5,882 | 6,534 | 6,106 | 5,999 |
| 2018 | 5,936 | 5,481 | 6,483 | 6,406 | 6,857 | 6,680 | 6,673 | 6,809 | 6,520 | 6,882 | 6,292 | 6,044 |
| 2019 | 5,863 | 5,704 | 7,249 | 7,400 | 6,765 | 6,777 | 6,713 | 6,840 | 6,375 | 6,371 | 5,786 | 6,029 |
| 2020 | 5,567 | 5,518 | 5,410 | 3,910 | 4,933 | 5,763 | 6,009 | 6,037 | 5,710 | 6,001 | 5,771 | 5,624 |
| 2021 | 5,331 | 5,143 | 7,030 | 6,915 | 6,291 | 6,279 | 6,249 | 6,531 | 5,980 | 5,999 | 5,808 | 5,874 |
| 2022 | 5,066 | 5,148 | 6,156 | 6,008 | 6,383 | 5,972 | 6,029 | 6,062 | 5,880 | 5,665 | 5,576 | 5,967 |
| 2023 | 5,461 | 5,091 | 6,185 | 6,492 | 6,582 | 6,700 | 6,154 | 6,433 | 5,797 | 6,004 | 5,671 | 5,490 |
| 2024 | 4,913 | 5,282 | ||||||||||
| - = No Data Reported; -- = Not Applicable; NA = Not Available; W = Withheld to avoid disclosure of individual company data. |
| Release Date: 4/30/2024 |
| Next Release Date: 5/31/2024 |