|
Download Data (XLS File) |
|
||||||||
|
||||||||
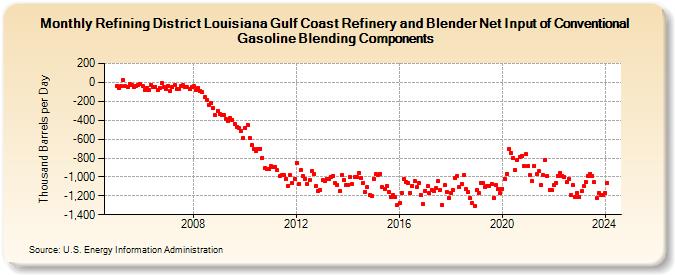
| Refining District Louisiana Gulf Coast Refinery and Blender Net Input of Conventional Gasoline Blending Components (Thousand Barrels per Day) | ||||||||
| Year | Jan | Feb | Mar | Apr | May | Jun | Jul | Aug | Sep | Oct | Nov | Dec |
|---|---|---|---|---|---|---|---|---|---|---|---|---|
| 2005 | -39 | -62 | -42 | 22 | -43 | -54 | -12 | -28 | -52 | -35 | -24 | -21 |
| 2006 | -40 | -77 | -55 | -80 | -25 | -45 | -46 | -85 | -56 | -7 | -45 | -68 |
| 2007 | -33 | -86 | -47 | -32 | -70 | -72 | -33 | -32 | -48 | -52 | -72 | -52 |
| 2008 | -43 | -83 | -58 | -91 | -106 | -157 | -189 | -235 | -220 | -270 | -350 | -300 |
| 2009 | -339 | -350 | -340 | -391 | -405 | -380 | -395 | -438 | -469 | -483 | -519 | -584 |
| 2010 | -482 | -453 | -584 | -667 | -707 | -726 | -702 | -700 | -795 | -910 | -916 | -919 |
| 2011 | -888 | -896 | -896 | -932 | -992 | -985 | -977 | -1,018 | -1,091 | -984 | -1,064 | -1,018 |
| 2012 | -849 | -1,071 | -925 | -995 | -1,019 | -1,072 | -1,028 | -934 | -971 | -1,099 | -1,144 | -1,138 |
| 2013 | -1,036 | -1,040 | -1,021 | -1,020 | -998 | -989 | -1,064 | -1,085 | -1,153 | -981 | -1,033 | -1,089 |
| 2014 | -1,082 | -1,002 | -1,076 | -996 | -1,005 | -955 | -1,014 | -1,066 | -1,156 | -1,111 | -1,195 | -1,198 |
| 2015 | -1,019 | -974 | -980 | -966 | -1,111 | -1,126 | -1,097 | -1,159 | -1,208 | -1,194 | -1,215 | -1,294 |
| 2016 | -1,281 | -1,166 | -1,022 | -1,051 | -1,062 | -1,165 | -1,094 | -1,045 | -1,110 | -1,060 | -1,192 | -1,288 |
| 2017 | -1,146 | -1,101 | -1,172 | -1,137 | -1,150 | -1,122 | -1,045 | -1,136 | -1,297 | -1,089 | -1,156 | -1,219 |
| 2018 | -1,168 | -1,139 | -1,015 | -992 | -1,109 | -1,070 | -982 | -1,128 | -1,163 | -1,224 | -1,277 | -1,304 |
| 2019 | -1,139 | -1,175 | -1,061 | -1,063 | -1,112 | -1,092 | -1,094 | -1,072 | -1,219 | -1,089 | -1,126 | -1,175 |
| 2020 | -1,125 | -1,018 | -965 | -703 | -742 | -798 | -922 | -824 | -787 | -776 | -885 | -761 |
| 2021 | -882 | -983 | -1,046 | -882 | -974 | -942 | -1,083 | -981 | -820 | -988 | -1,141 | -1,137 |
| 2022 | -1,087 | -1,062 | -988 | -956 | -991 | -1,004 | -1,058 | -1,020 | -1,195 | -1,087 | -1,217 | -1,168 |
| 2023 | -1,214 | -1,154 | -1,099 | -1,051 | -993 | -966 | -987 | -1,058 | -1,227 | -1,172 | -1,187 | -1,187 |
| 2024 | -1,167 | |||||||||||
| - = No Data Reported; -- = Not Applicable; NA = Not Available; W = Withheld to avoid disclosure of individual company data. |
| Release Date: 3/29/2024 |
| Next Release Date: 4/30/2024 |