|
Download Data (XLS File) |
|
||||||||
|
||||||||
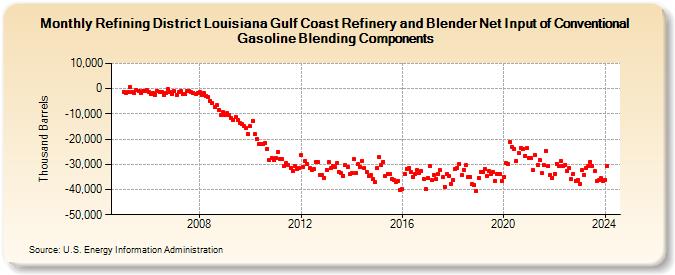
| Refining District Louisiana Gulf Coast Refinery and Blender Net Input of Conventional Gasoline Blending Components (Thousand Barrels) | ||||||||
| Year | Jan | Feb | Mar | Apr | May | Jun | Jul | Aug | Sep | Oct | Nov | Dec |
|---|---|---|---|---|---|---|---|---|---|---|---|---|
| 2005 | -1,194 | -1,736 | -1,305 | 646 | -1,348 | -1,619 | -357 | -881 | -1,554 | -1,091 | -734 | -640 |
| 2006 | -1,234 | -2,142 | -1,712 | -2,402 | -769 | -1,356 | -1,429 | -2,626 | -1,680 | -204 | -1,344 | -2,110 |
| 2007 | -1,038 | -2,394 | -1,456 | -965 | -2,155 | -2,149 | -1,029 | -982 | -1,444 | -1,613 | -2,159 | -1,603 |
| 2008 | -1,324 | -2,405 | -1,805 | -2,723 | -3,289 | -4,718 | -5,849 | -7,291 | -6,593 | -8,357 | -10,491 | -9,302 |
| 2009 | -10,522 | -9,811 | -10,551 | -11,721 | -12,542 | -11,390 | -12,230 | -13,574 | -14,079 | -14,978 | -15,575 | -18,117 |
| 2010 | -14,946 | -12,683 | -18,106 | -20,006 | -21,931 | -21,792 | -21,775 | -21,688 | -23,839 | -28,220 | -27,483 | -28,486 |
| 2011 | -27,542 | -25,075 | -27,779 | -27,957 | -30,740 | -29,545 | -30,279 | -31,544 | -32,716 | -30,507 | -31,932 | -31,544 |
| 2012 | -26,325 | -31,065 | -28,687 | -29,856 | -31,583 | -32,151 | -31,869 | -28,940 | -29,136 | -34,058 | -34,330 | -35,265 |
| 2013 | -32,108 | -29,109 | -31,649 | -30,596 | -30,930 | -29,658 | -32,974 | -33,635 | -34,588 | -30,406 | -30,982 | -33,764 |
| 2014 | -33,553 | -28,057 | -33,354 | -29,882 | -31,156 | -28,657 | -31,423 | -33,039 | -34,688 | -34,440 | -35,852 | -37,134 |
| 2015 | -31,594 | -27,261 | -30,373 | -28,978 | -34,447 | -33,784 | -33,998 | -35,929 | -36,250 | -37,001 | -36,459 | -40,108 |
| 2016 | -39,717 | -33,808 | -31,668 | -31,528 | -32,915 | -34,946 | -33,926 | -32,387 | -33,311 | -32,855 | -35,754 | -39,919 |
| 2017 | -35,537 | -30,840 | -36,331 | -34,111 | -35,656 | -33,654 | -32,408 | -35,231 | -38,895 | -33,768 | -34,681 | -37,777 |
| 2018 | -36,202 | -31,893 | -31,465 | -29,773 | -34,364 | -32,113 | -30,433 | -34,966 | -34,887 | -37,931 | -38,296 | -40,429 |
| 2019 | -35,304 | -32,900 | -32,903 | -31,890 | -34,484 | -32,760 | -33,912 | -33,236 | -36,569 | -33,773 | -33,794 | -36,439 |
| 2020 | -34,873 | -29,530 | -29,923 | -21,091 | -23,003 | -23,928 | -28,593 | -25,544 | -23,624 | -24,044 | -26,539 | -23,583 |
| 2021 | -27,351 | -27,511 | -32,414 | -26,455 | -30,206 | -28,256 | -33,570 | -30,402 | -24,609 | -30,640 | -34,224 | -35,252 |
| 2022 | -33,700 | -29,723 | -30,641 | -28,665 | -30,717 | -30,128 | -32,783 | -31,619 | -35,849 | -33,702 | -36,510 | -36,196 |
| 2023 | -37,634 | -32,304 | -34,068 | -31,523 | -30,790 | -28,971 | -30,590 | -32,804 | -36,807 | -36,346 | -35,619 | -36,784 |
| 2024 | -36,186 | -30,729 | ||||||||||
| - = No Data Reported; -- = Not Applicable; NA = Not Available; W = Withheld to avoid disclosure of individual company data. |
| Release Date: 4/30/2024 |
| Next Release Date: 5/31/2024 |