|
Download Data (XLS File) |
|
||||||||
|
||||||||
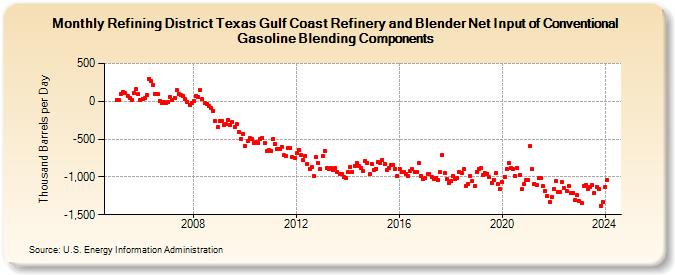
| Refining District Texas Gulf Coast Refinery and Blender Net Input of Conventional Gasoline Blending Components (Thousand Barrels per Day) | ||||||||
| Year | Jan | Feb | Mar | Apr | May | Jun | Jul | Aug | Sep | Oct | Nov | Dec |
|---|---|---|---|---|---|---|---|---|---|---|---|---|
| 2005 | 22 | 11 | 101 | 120 | 112 | 70 | 48 | 22 | 116 | 162 | 96 | 14 |
| 2006 | 34 | 37 | 85 | 299 | 267 | 217 | 99 | 98 | 9 | -28 | -8 | -22 |
| 2007 | -15 | 54 | 22 | 46 | 145 | 95 | 78 | 74 | 25 | -9 | -48 | -27 |
| 2008 | -2 | 67 | 61 | 150 | 28 | -29 | -42 | -64 | -90 | -123 | -262 | -342 |
| 2009 | -255 | -259 | -316 | -301 | -243 | -316 | -278 | -334 | -303 | -409 | -494 | -428 |
| 2010 | -592 | -527 | -490 | -494 | -554 | -544 | -551 | -495 | -485 | -548 | -655 | -650 |
| 2011 | -657 | -495 | -566 | -635 | -631 | -598 | -714 | -722 | -620 | -618 | -743 | -752 |
| 2012 | -690 | -640 | -716 | -777 | -717 | -825 | -898 | -871 | -989 | -740 | -817 | -900 |
| 2013 | -725 | -651 | -886 | -899 | -879 | -905 | -879 | -935 | -958 | -956 | -1,007 | -1,015 |
| 2014 | -941 | -863 | -932 | -850 | -818 | -853 | -887 | -925 | -791 | -819 | -968 | -829 |
| 2015 | -915 | -889 | -809 | -821 | -771 | -825 | -913 | -884 | -836 | -838 | -889 | -982 |
| 2016 | -892 | -939 | -938 | -962 | -988 | -917 | -902 | -940 | -933 | -816 | -988 | -1,031 |
| 2017 | -1,012 | -959 | -958 | -996 | -1,025 | -1,010 | -1,044 | -937 | -711 | -953 | -1,034 | -1,080 |
| 2018 | -1,057 | -990 | -1,030 | -1,016 | -934 | -947 | -895 | -1,120 | -1,100 | -989 | -1,057 | -1,121 |
| 2019 | -935 | -892 | -886 | -981 | -949 | -958 | -1,006 | -1,083 | -1,035 | -943 | -1,095 | -1,161 |
| 2020 | -1,072 | -996 | -896 | -817 | -881 | -898 | -994 | -876 | -977 | -1,165 | -1,098 | -1,041 |
| 2021 | -1,044 | -589 | -895 | -1,090 | -1,102 | -1,018 | -1,019 | -1,123 | -1,188 | -1,252 | -1,326 | -1,267 |
| 2022 | -1,156 | -1,052 | -1,193 | -1,194 | -1,069 | -1,153 | -1,192 | -1,123 | -1,217 | -1,215 | -1,301 | -1,245 |
| 2023 | -1,322 | -1,350 | -1,120 | -1,104 | -1,161 | -1,134 | -1,109 | -1,217 | -1,128 | -1,164 | -1,381 | -1,333 |
| 2024 | -1,129 | -1,044 | -1,306 | -1,197 | -1,280 | -1,232 | ||||||
| - = No Data Reported; -- = Not Applicable; NA = Not Available; W = Withheld to avoid disclosure of individual company data. |
| Release Date: 8/30/2024 |
| Next Release Date: 9/30/2024 |