|
Download Data (XLS File) |
|
||||||||
|
||||||||
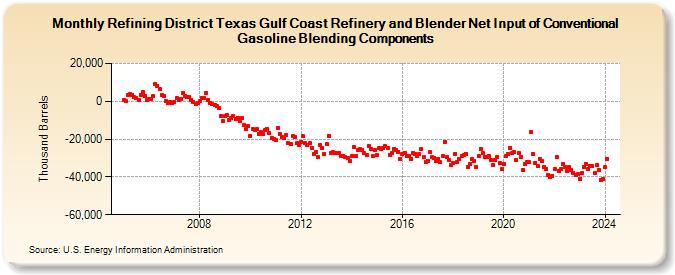
| Refining District Texas Gulf Coast Refinery and Blender Net Input of Conventional Gasoline Blending Components (Thousand Barrels) | ||||||||
| Year | Jan | Feb | Mar | Apr | May | Jun | Jul | Aug | Sep | Oct | Nov | Dec |
|---|---|---|---|---|---|---|---|---|---|---|---|---|
| 2005 | 669 | 321 | 3,118 | 3,606 | 3,470 | 2,108 | 1,497 | 675 | 3,465 | 5,011 | 2,879 | 439 |
| 2006 | 1,069 | 1,040 | 2,636 | 8,973 | 8,266 | 6,499 | 3,075 | 3,050 | 278 | -865 | -244 | -696 |
| 2007 | -472 | 1,503 | 686 | 1,368 | 4,504 | 2,843 | 2,411 | 2,294 | 764 | -268 | -1,439 | -842 |
| 2008 | -51 | 1,936 | 1,877 | 4,489 | 882 | -861 | -1,307 | -1,974 | -2,706 | -3,814 | -7,873 | -10,617 |
| 2009 | -7,892 | -7,252 | -9,799 | -9,039 | -7,532 | -9,478 | -8,613 | -10,368 | -9,094 | -12,684 | -14,811 | -13,253 |
| 2010 | -18,343 | -14,754 | -15,177 | -14,807 | -17,171 | -16,330 | -17,086 | -15,334 | -14,547 | -16,987 | -19,638 | -20,139 |
| 2011 | -20,360 | -13,866 | -17,541 | -19,050 | -19,555 | -17,942 | -22,130 | -22,392 | -18,613 | -19,145 | -22,278 | -23,320 |
| 2012 | -21,385 | -18,546 | -22,194 | -23,314 | -22,233 | -24,757 | -27,831 | -27,011 | -29,659 | -22,931 | -24,517 | -27,899 |
| 2013 | -22,475 | -18,214 | -27,472 | -26,964 | -27,234 | -27,155 | -27,257 | -28,990 | -28,727 | -29,635 | -30,216 | -31,455 |
| 2014 | -29,156 | -24,173 | -28,906 | -25,513 | -25,373 | -25,589 | -27,509 | -28,660 | -23,726 | -25,397 | -29,044 | -25,712 |
| 2015 | -28,379 | -24,898 | -25,084 | -24,635 | -23,912 | -24,750 | -28,295 | -27,389 | -25,072 | -25,982 | -26,681 | -30,441 |
| 2016 | -27,660 | -27,218 | -29,089 | -28,865 | -30,624 | -27,498 | -27,950 | -29,130 | -27,991 | -25,288 | -29,628 | -31,972 |
| 2017 | -31,376 | -26,852 | -29,688 | -29,866 | -31,790 | -30,307 | -32,376 | -29,051 | -21,323 | -29,539 | -31,014 | -33,495 |
| 2018 | -32,777 | -27,721 | -31,927 | -30,487 | -28,959 | -28,399 | -27,742 | -34,726 | -32,989 | -30,664 | -31,705 | -34,751 |
| 2019 | -29,000 | -24,987 | -27,475 | -29,418 | -29,420 | -28,739 | -31,171 | -33,581 | -31,059 | -29,246 | -32,844 | -35,999 |
| 2020 | -33,219 | -28,896 | -27,785 | -24,509 | -27,300 | -26,941 | -30,806 | -27,162 | -29,309 | -36,112 | -32,951 | -32,258 |
| 2021 | -32,378 | -16,481 | -27,742 | -32,695 | -34,158 | -30,525 | -31,589 | -34,822 | -35,643 | -38,806 | -39,792 | -39,275 |
| 2022 | -35,838 | -29,445 | -36,981 | -35,817 | -33,126 | -34,586 | -36,949 | -34,820 | -36,503 | -37,670 | -39,041 | -38,606 |
| 2023 | -40,972 | -37,794 | -34,725 | -33,127 | -35,995 | -34,029 | -34,383 | -37,728 | -33,857 | -36,098 | -41,426 | -41,319 |
| 2024 | -34,989 | -30,284 | ||||||||||
| - = No Data Reported; -- = Not Applicable; NA = Not Available; W = Withheld to avoid disclosure of individual company data. |
| Release Date: 4/30/2024 |
| Next Release Date: 5/31/2024 |